Spot High-Growth Categories Months Before They Saturate
Spot high-growth concepts months before saturation across domestic and international markets. Track emerging categories through complete lifecycle from Startup to Exit.
Opportunity Detection Capabilities
How MoTrends identifies high-growth concepts before they saturate
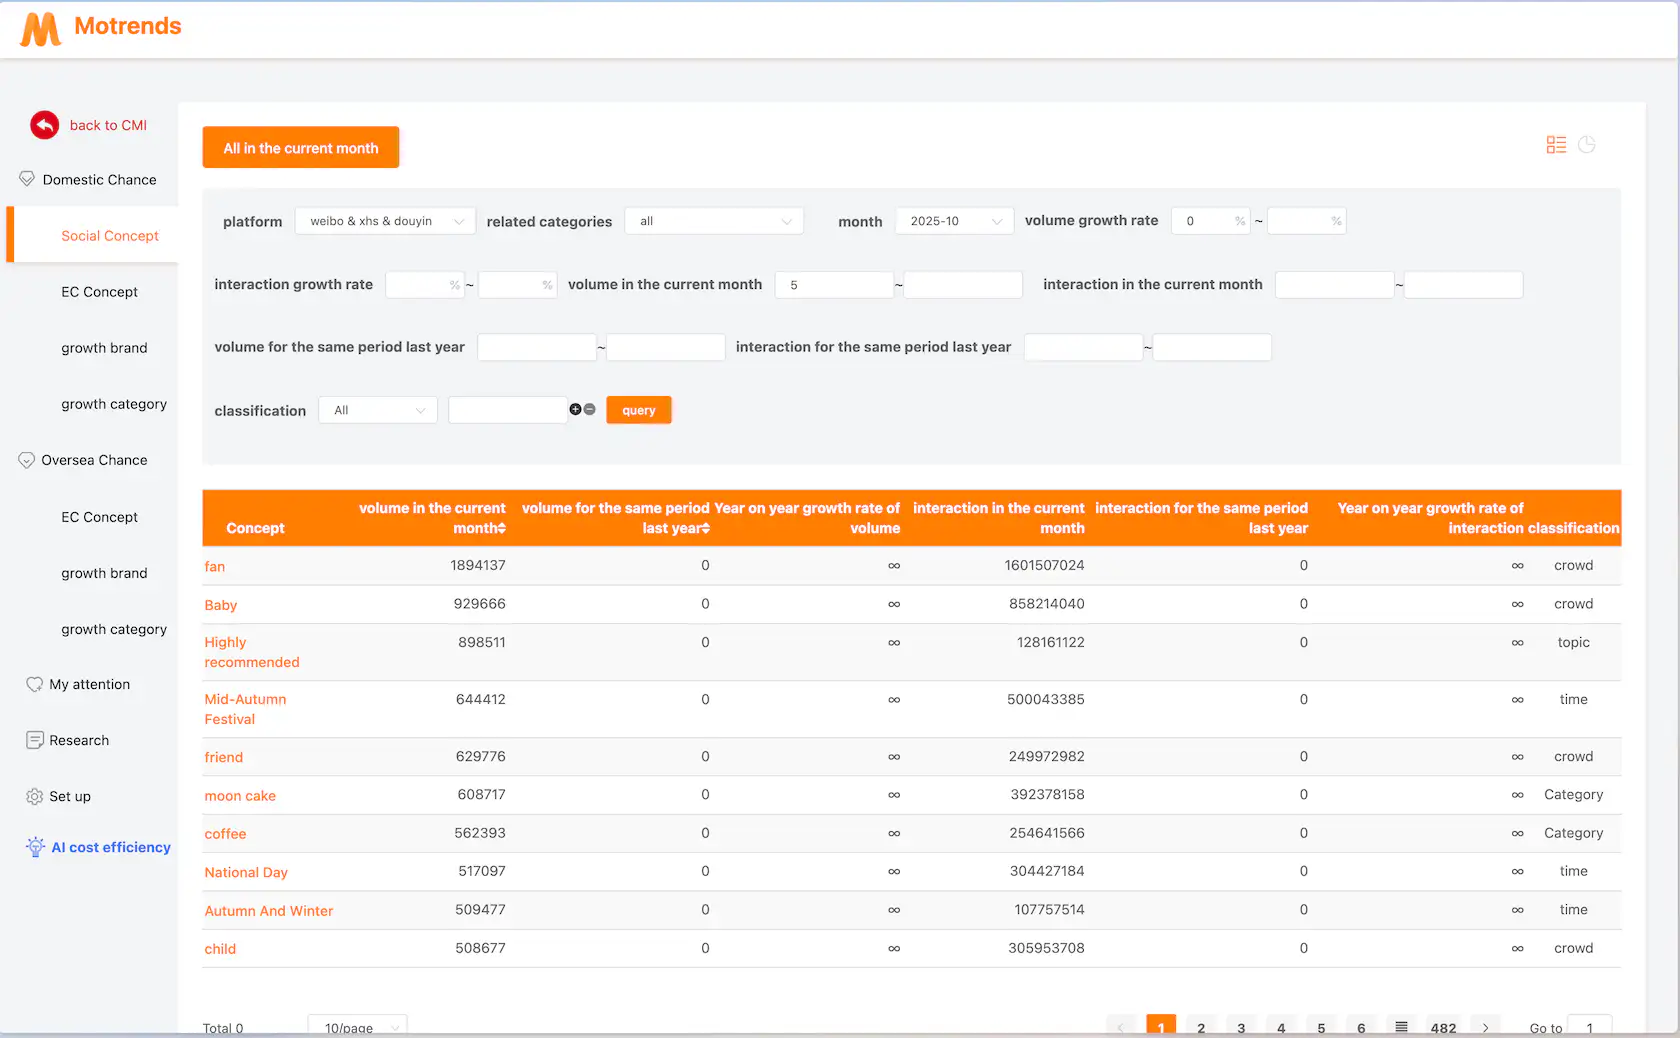
High-Growth Concept Detection
Algorithm detects products and categories with accelerating growth trajectories. Highlight emerging trends months before they become saturated.
-
Detect accelerating growth patterns
-
Track momentum indicators
-
Monitor search volume spikes
-
Alert on Blue Ocean closing windows
Example: Detect "low-sugar sparkling water" trending on social media platforms (50% MoM search growth) and gaining sales traction on major e-commerce platforms (30+ new brands in Q1). Alert: Blue Ocean closing in 3-6 months.
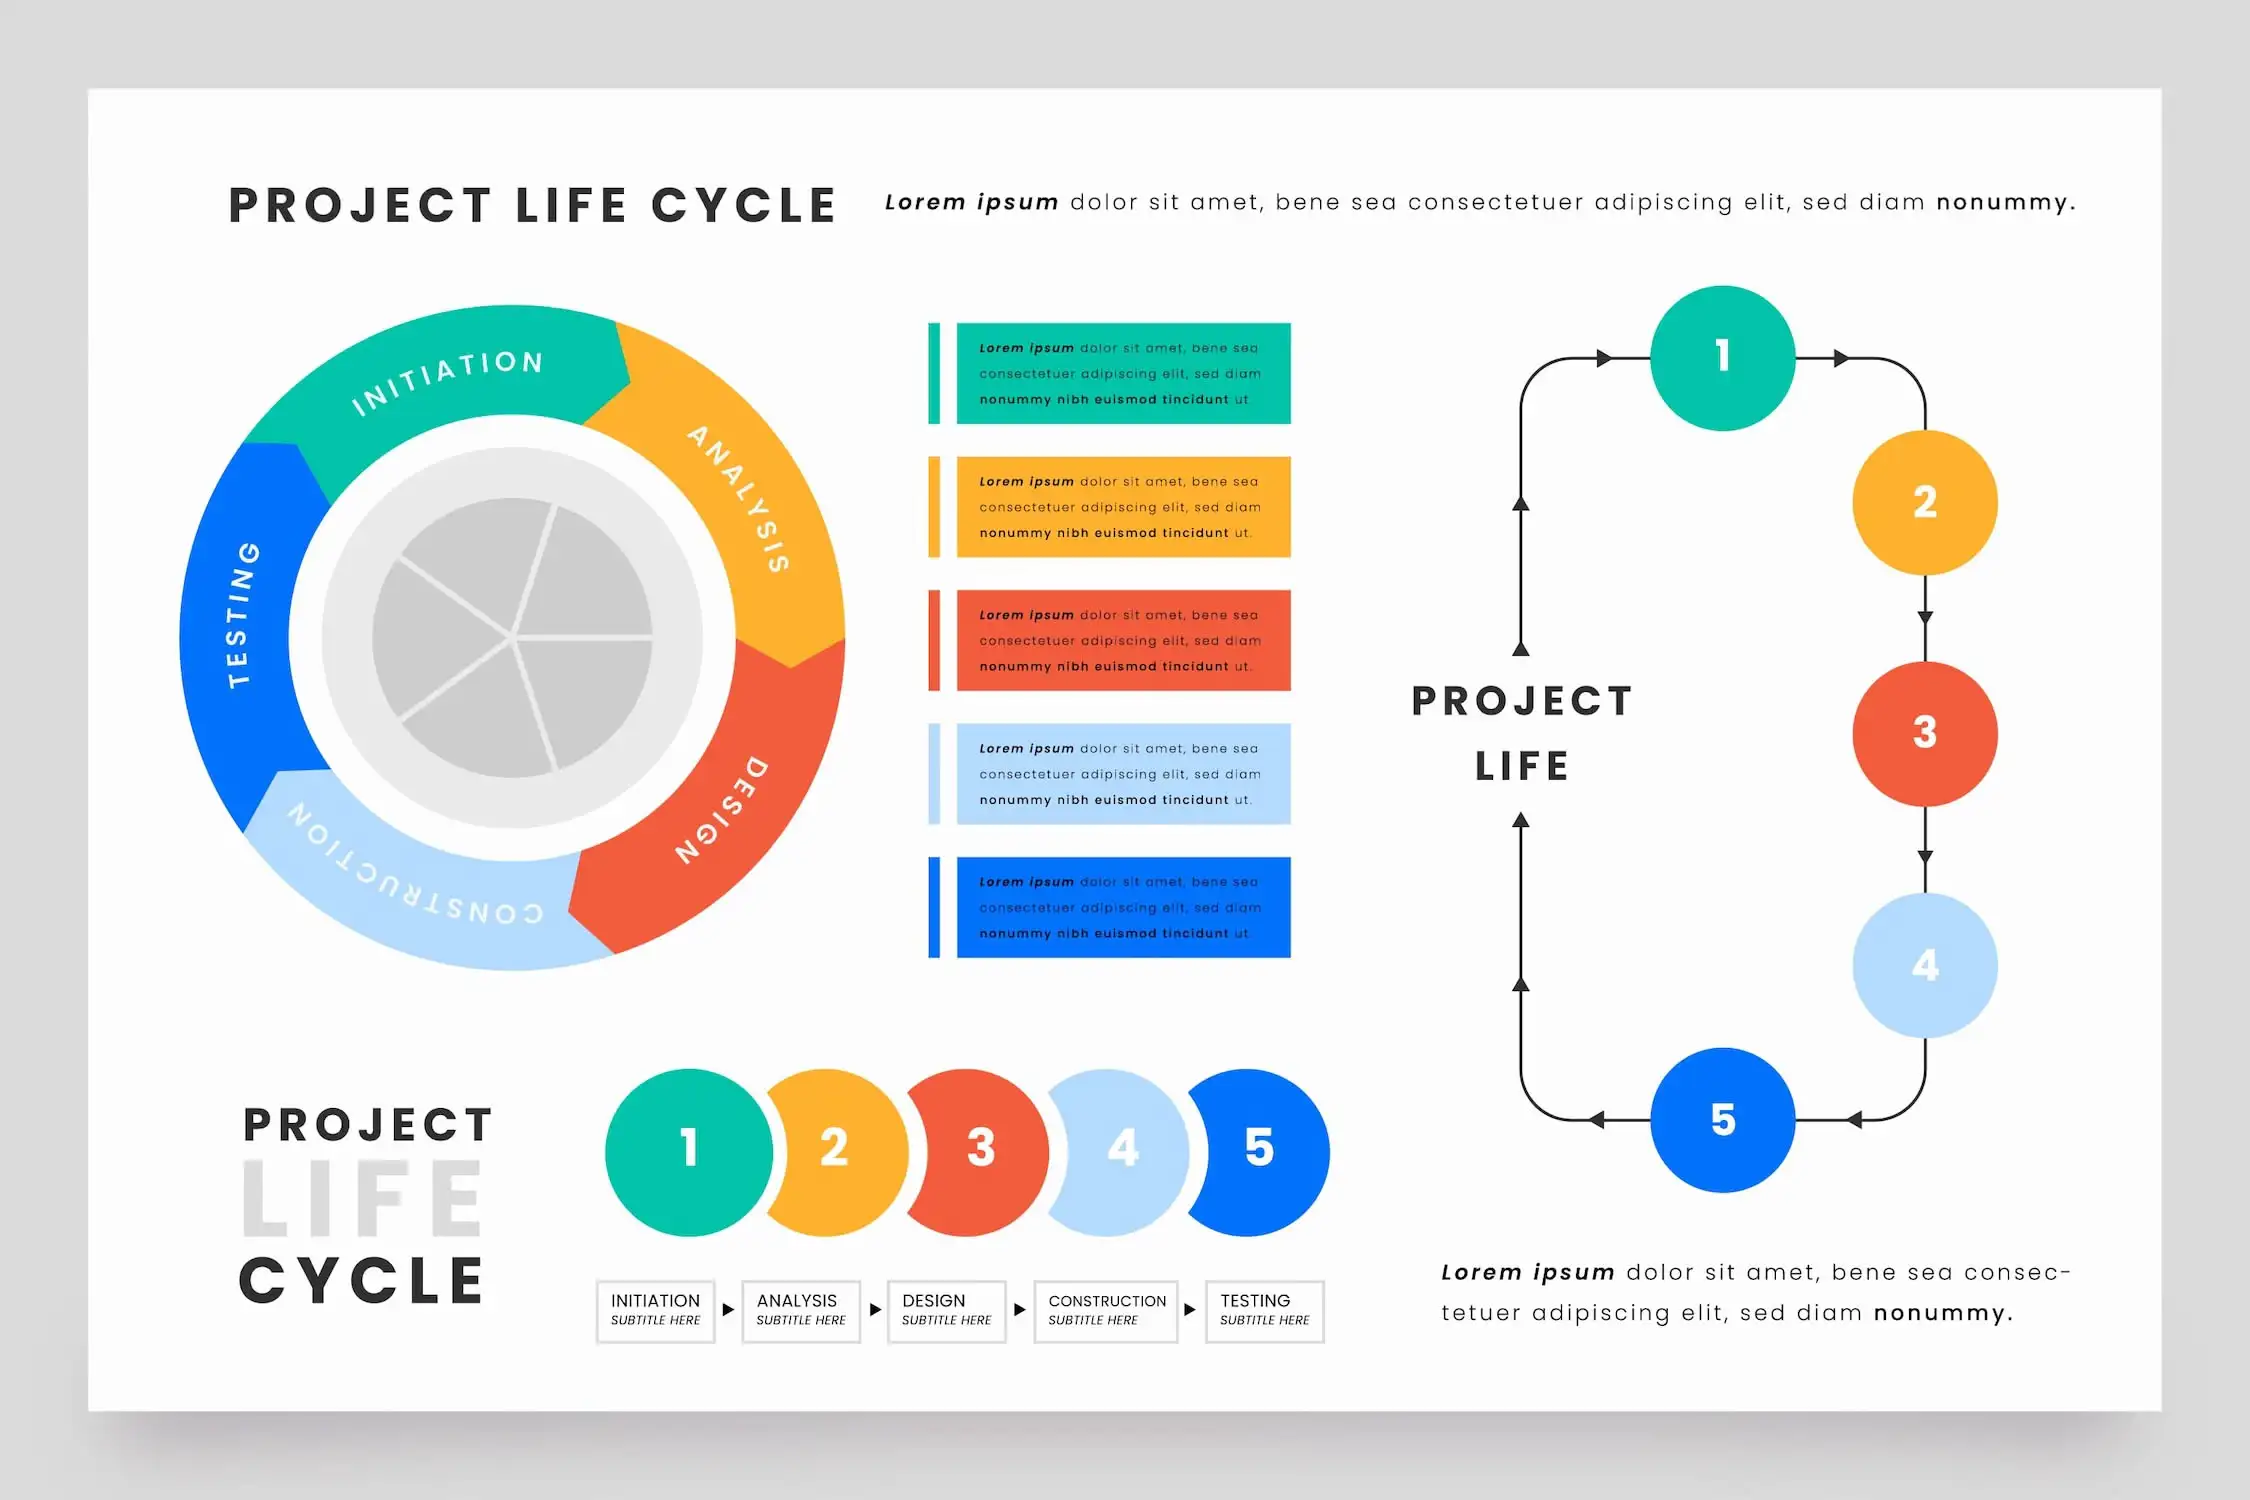
Complete Lifecycle Tracking
Monitor categories through Startup → Growth → Stable → Decline → Exit stages. Know when to enter and when to exit.
-
Track all 5 lifecycle stages
-
Optimal entry timing (Growth stage)
-
Exit signals (Decline stage)
-
Strategic recommendations by stage
Example: "Oat milk" now in Stable stage (month 24+). Competition intense. Consider entering adjacent categories like "oat yogurt" (Growth stage, month 8) or "oat protein powder" (Startup stage, month 2).
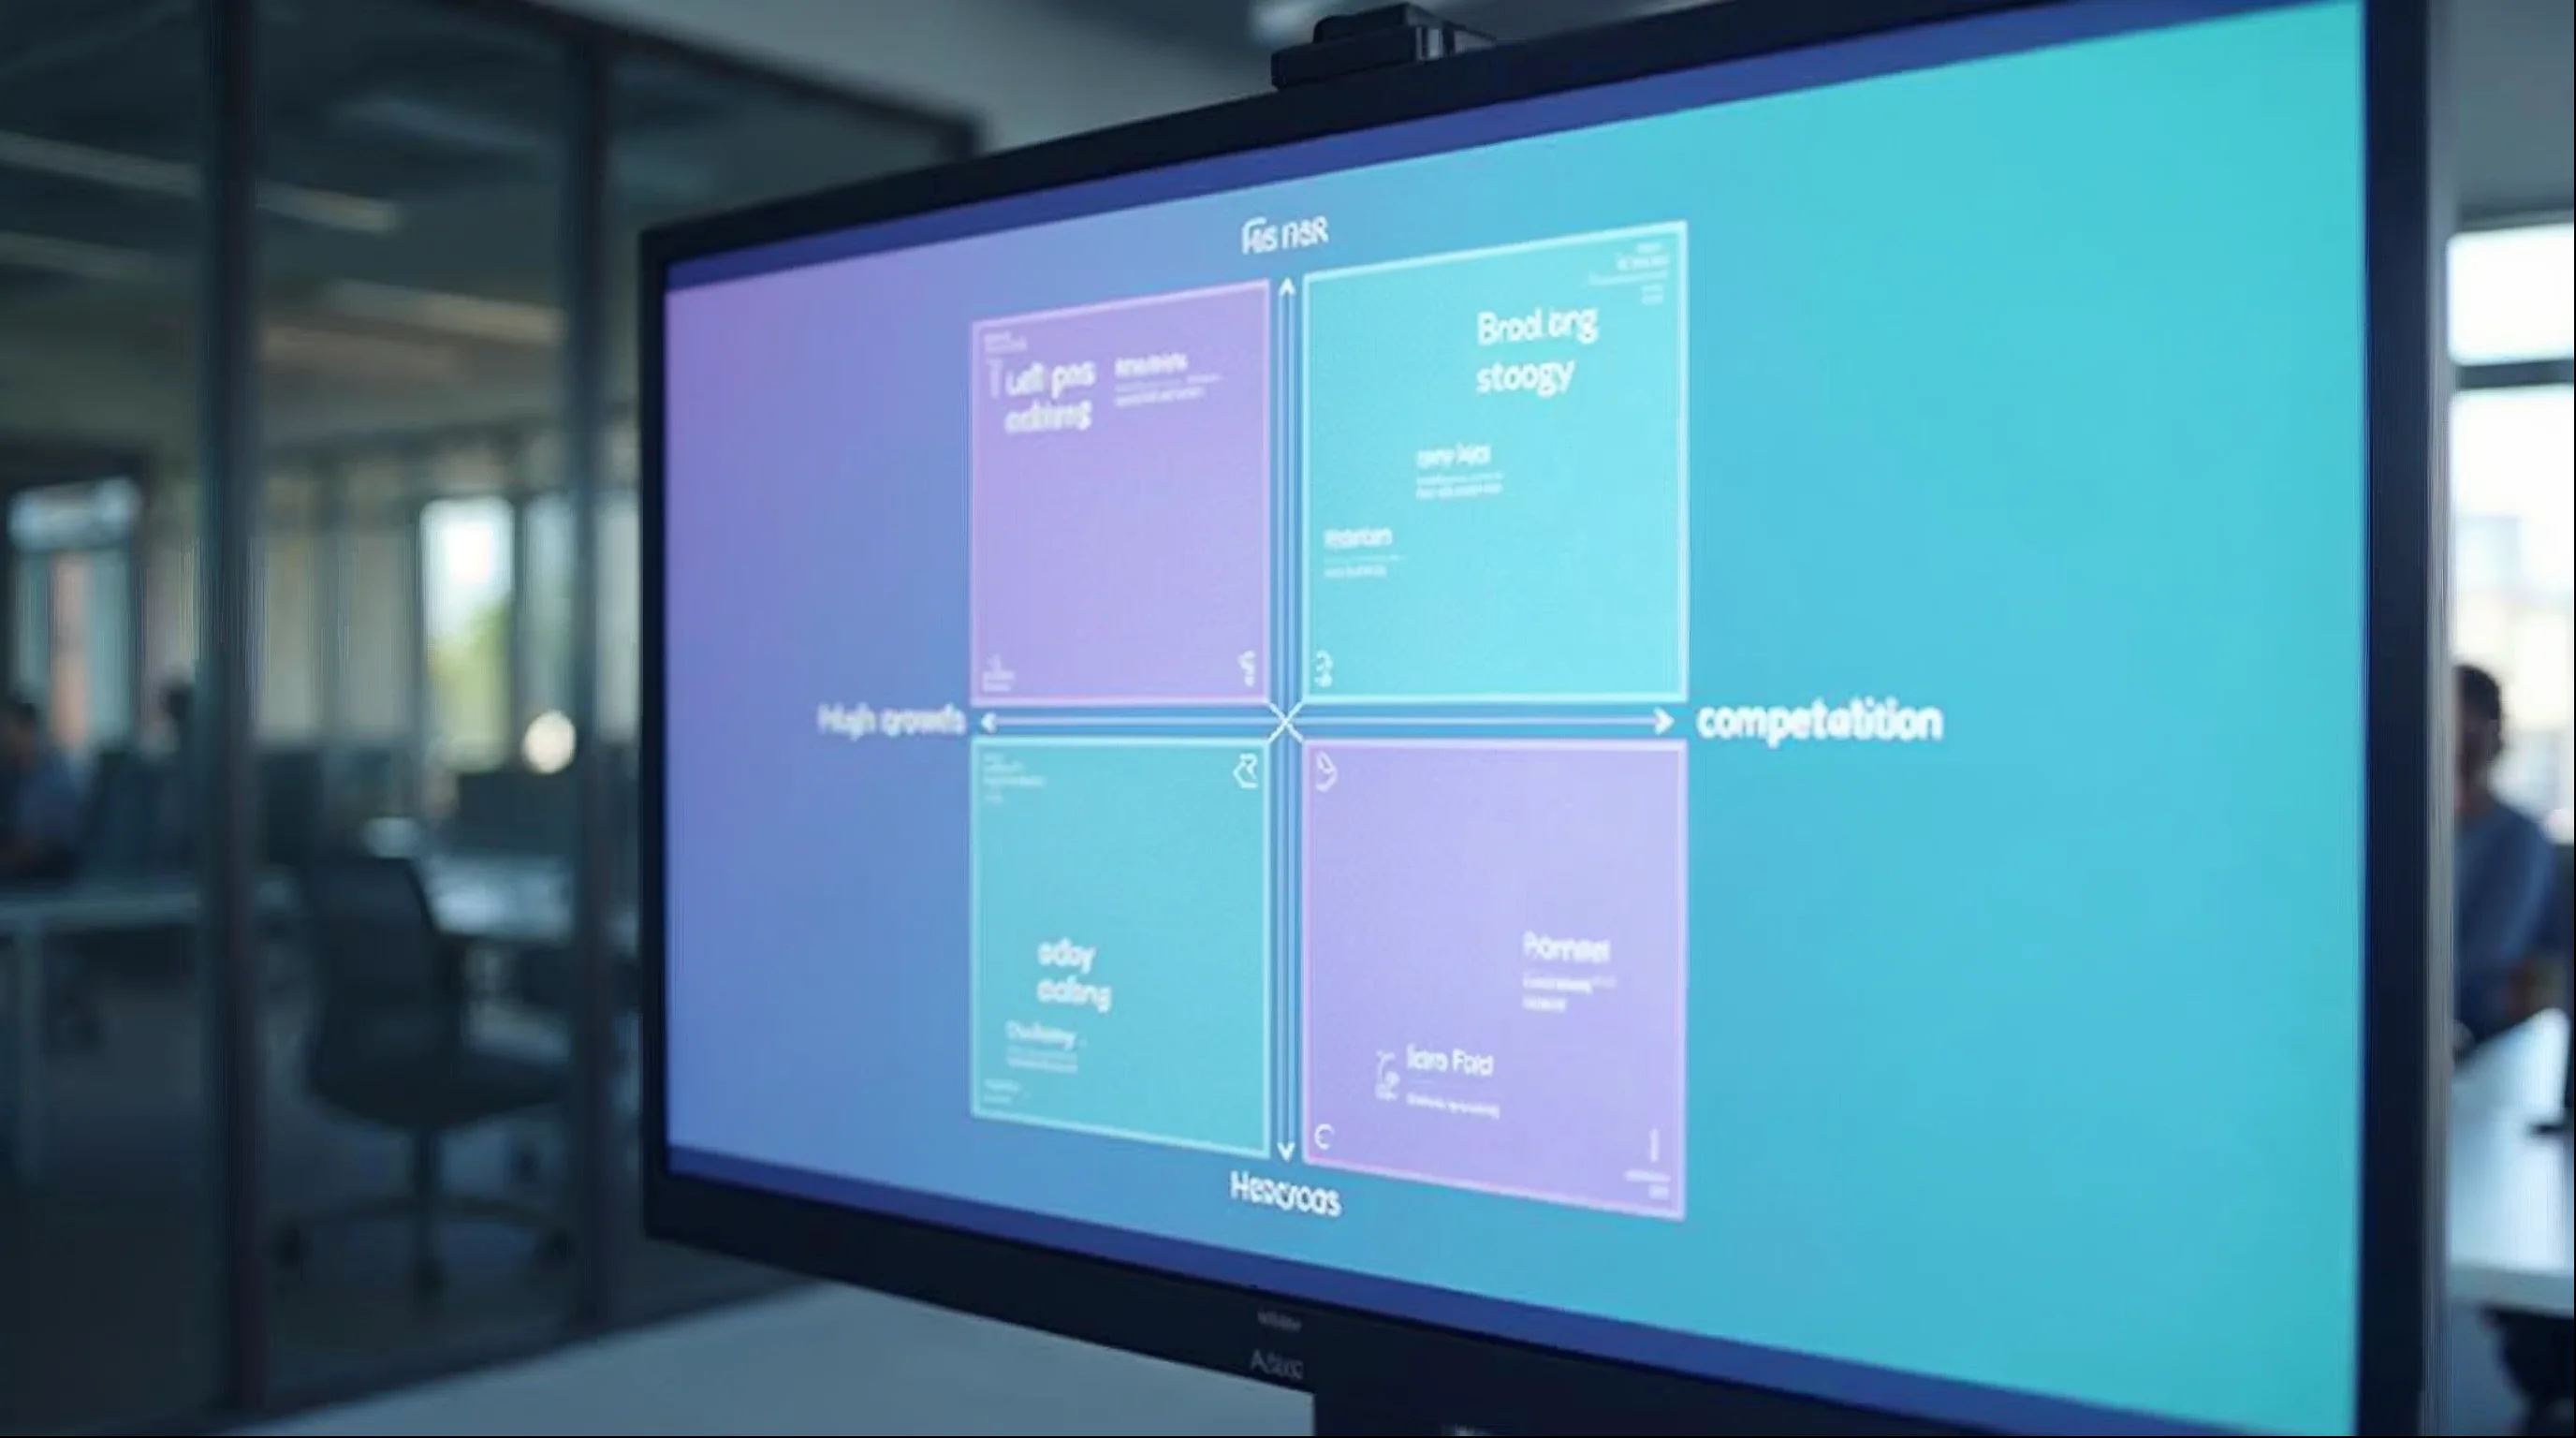
Blue Ocean vs Red Ocean Analysis
Visualize opportunities across growth rate + competitive intensity dimensions. Identify Blue Ocean markets to enter aggressively.
-
2x2 matrix visualization
-
Blue Ocean identification (high growth, low competition)
-
Red Ocean warnings (saturated markets)
-
Strategic recommendations by quadrant
Example: Boston Matrix shows "sugar-free chocolate" in Blue Ocean quadrant (80% YoY growth, 15 brands). "Protein bars" in Red Ocean (10% growth, 200+ brands). Recommendation: Enter sugar-free, avoid protein bars.
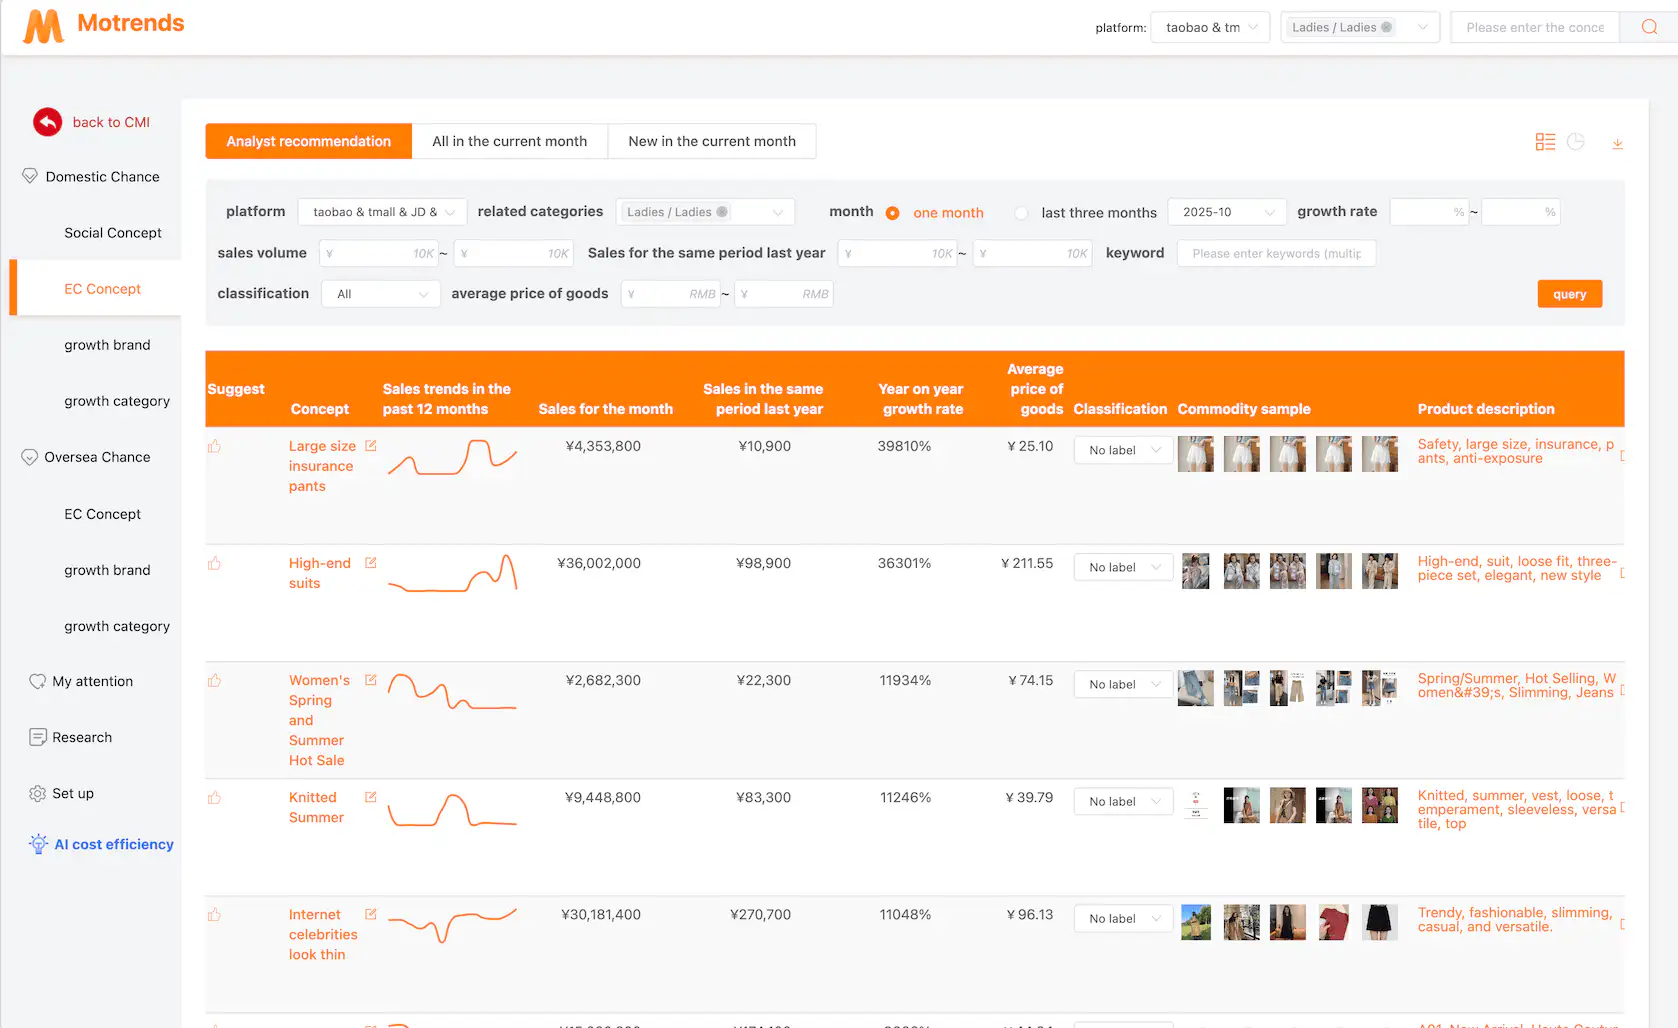
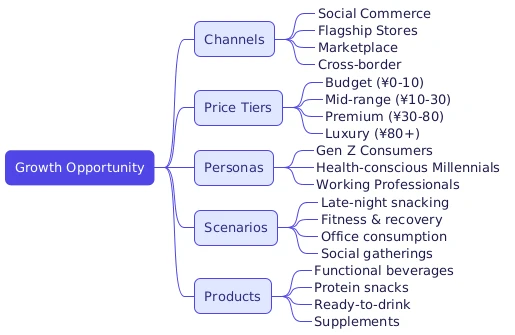
Multi-Dimensional Opportunity Mapping
Analyze growth across 5 dimensions: Channels, Price, Personas, Scenarios, Products. Pinpoint exactly where growth is happening.
-
5-dimensional growth analysis
-
Channel-specific insights
-
Price segment opportunities
-
Persona and scenario targeting
Example: "Energy drinks" growing fastest in Social Commerce (Channel) + ¥10-15 price tier (Price) + Gen Z gamers (Persona) + late-night gaming (Scenario) . Launch product targeting these exact dimensions.
Strategic Use Cases
How enterprises use MoTrends to drive innovation and growth

Discover emerging concepts for new product development. Validate trend longevity before investing. Identify optimal entry timing.
-
Find concepts in Startup stage (low risk testing)
-
Validate with social sentiment data
-
Enter at Growth stage for maximum returns
-
Track feature preferences via 5D analysis
"Identified 'adaptogenic beverages' 8 months before competitors. Launched in Growth stage, achieved 40% market share." - FMCG Brand Manager

Find high-growth categories in new markets. Assess competitive intensity. Prioritize market entry decisions.
-
Compare China vs ASEAN vs Western trends
-
Identify Blue Ocean markets overseas
-
Assess lifecycle stage in target countries
-
Benchmark price positioning across markets
"Used MoTrends to enter Southeast Asia. Found 'bubble tea powder' in Growth stage (Thailand) vs Decline (China). Pivoted strategy." - International Expansion Director
Identify declining categories to exit. Rebalance portfolio toward growth areas. Optimize resource allocation.
-
Flag products in Decline/Exit stages
-
Reallocate budget to Growth opportunities
-
Monitor Red Ocean risks for existing SKUs
-
Balance portfolio across lifecycle stages
"Exited 3 declining categories (saved $2M). Reinvested in 2 Growth-stage trends. Portfolio growth: 15% → 35% YoY." - Portfolio Strategy Lead
Enterprises We've Worked With
Helping leading APAC brands across FMCG, retail, and e-commerce


Brands Using MoTrends
See how leading brands transform their market intelligence with MooJing.

Luolai Home Textiles
8M yuan first-month sales and 42% YoY growth through consumer insights

Nippon Paint
Data-driven market entry strategy for art paint category in China

Lin's Home
GMV +200% through data-driven furniture product development
Integrate with MoInsights Suite
Combine MoTrends with other modules for complete market intelligence
Frequently Asked Questions
Common questions about MoTrends trend detection
MoTrends is a FMCG trend detection platform by Moojing Global that identifies growth opportunities across 30+ e-commerce platforms in 20+ countries. It uses product lifecycle tracking, Boston Matrix analysis, and competitive segmentation to help brands spot emerging categories before competitors.
MoTrends analyzes sales velocity, new product launch rates, pricing shifts, and search volume patterns across e-commerce platforms. It applies product lifecycle stage classification (introduction, growth, maturity, decline) and identifies categories moving from niche to mainstream.
MoAnalysis focuses on competitive sales monitoring — tracking existing brands and products in established categories. MoTrends focuses on forward-looking trend detection — identifying emerging categories, whitespace opportunities, and demand shifts before they appear in mainstream sales data.
MoTrends segments product categories into Red Ocean (highly competitive, saturated markets with many established players) and Blue Ocean (underserved markets with high growth potential and low competition). This helps brands prioritize where to invest R&D and marketing resources.
MoTrends typically identifies emerging trends 2-3 months before they appear in mainstream sales data. For seasonal categories, it provides quarterly demand forecasts. The platform tracks early signals like ingredient trends, social buzz spikes, and new product launch clusters.
Account provisioning typically completes within a few business days of agreement. Your team receives dashboard access with pre-configured views for your category and competitive set.
Spot Trends Before Your Competitors
Request your free data sample. See Blue Ocean opportunities in your category with live trend data.