Spot Market Opportunities & Threats Weeks Earlier
Quarterly reports are outdated upon arrival, and competitors are moving fast with data you don't have. MoAnalysis closes the gap — with competitive sales intelligence across 400K+ brands in 20+ countries, updated weekly.
Answering Every Question; From Boardroom to Inventory
Whether you're setting strategy or optimizing operations, MoAnalysis gives you the data to make the call with confidence.
-
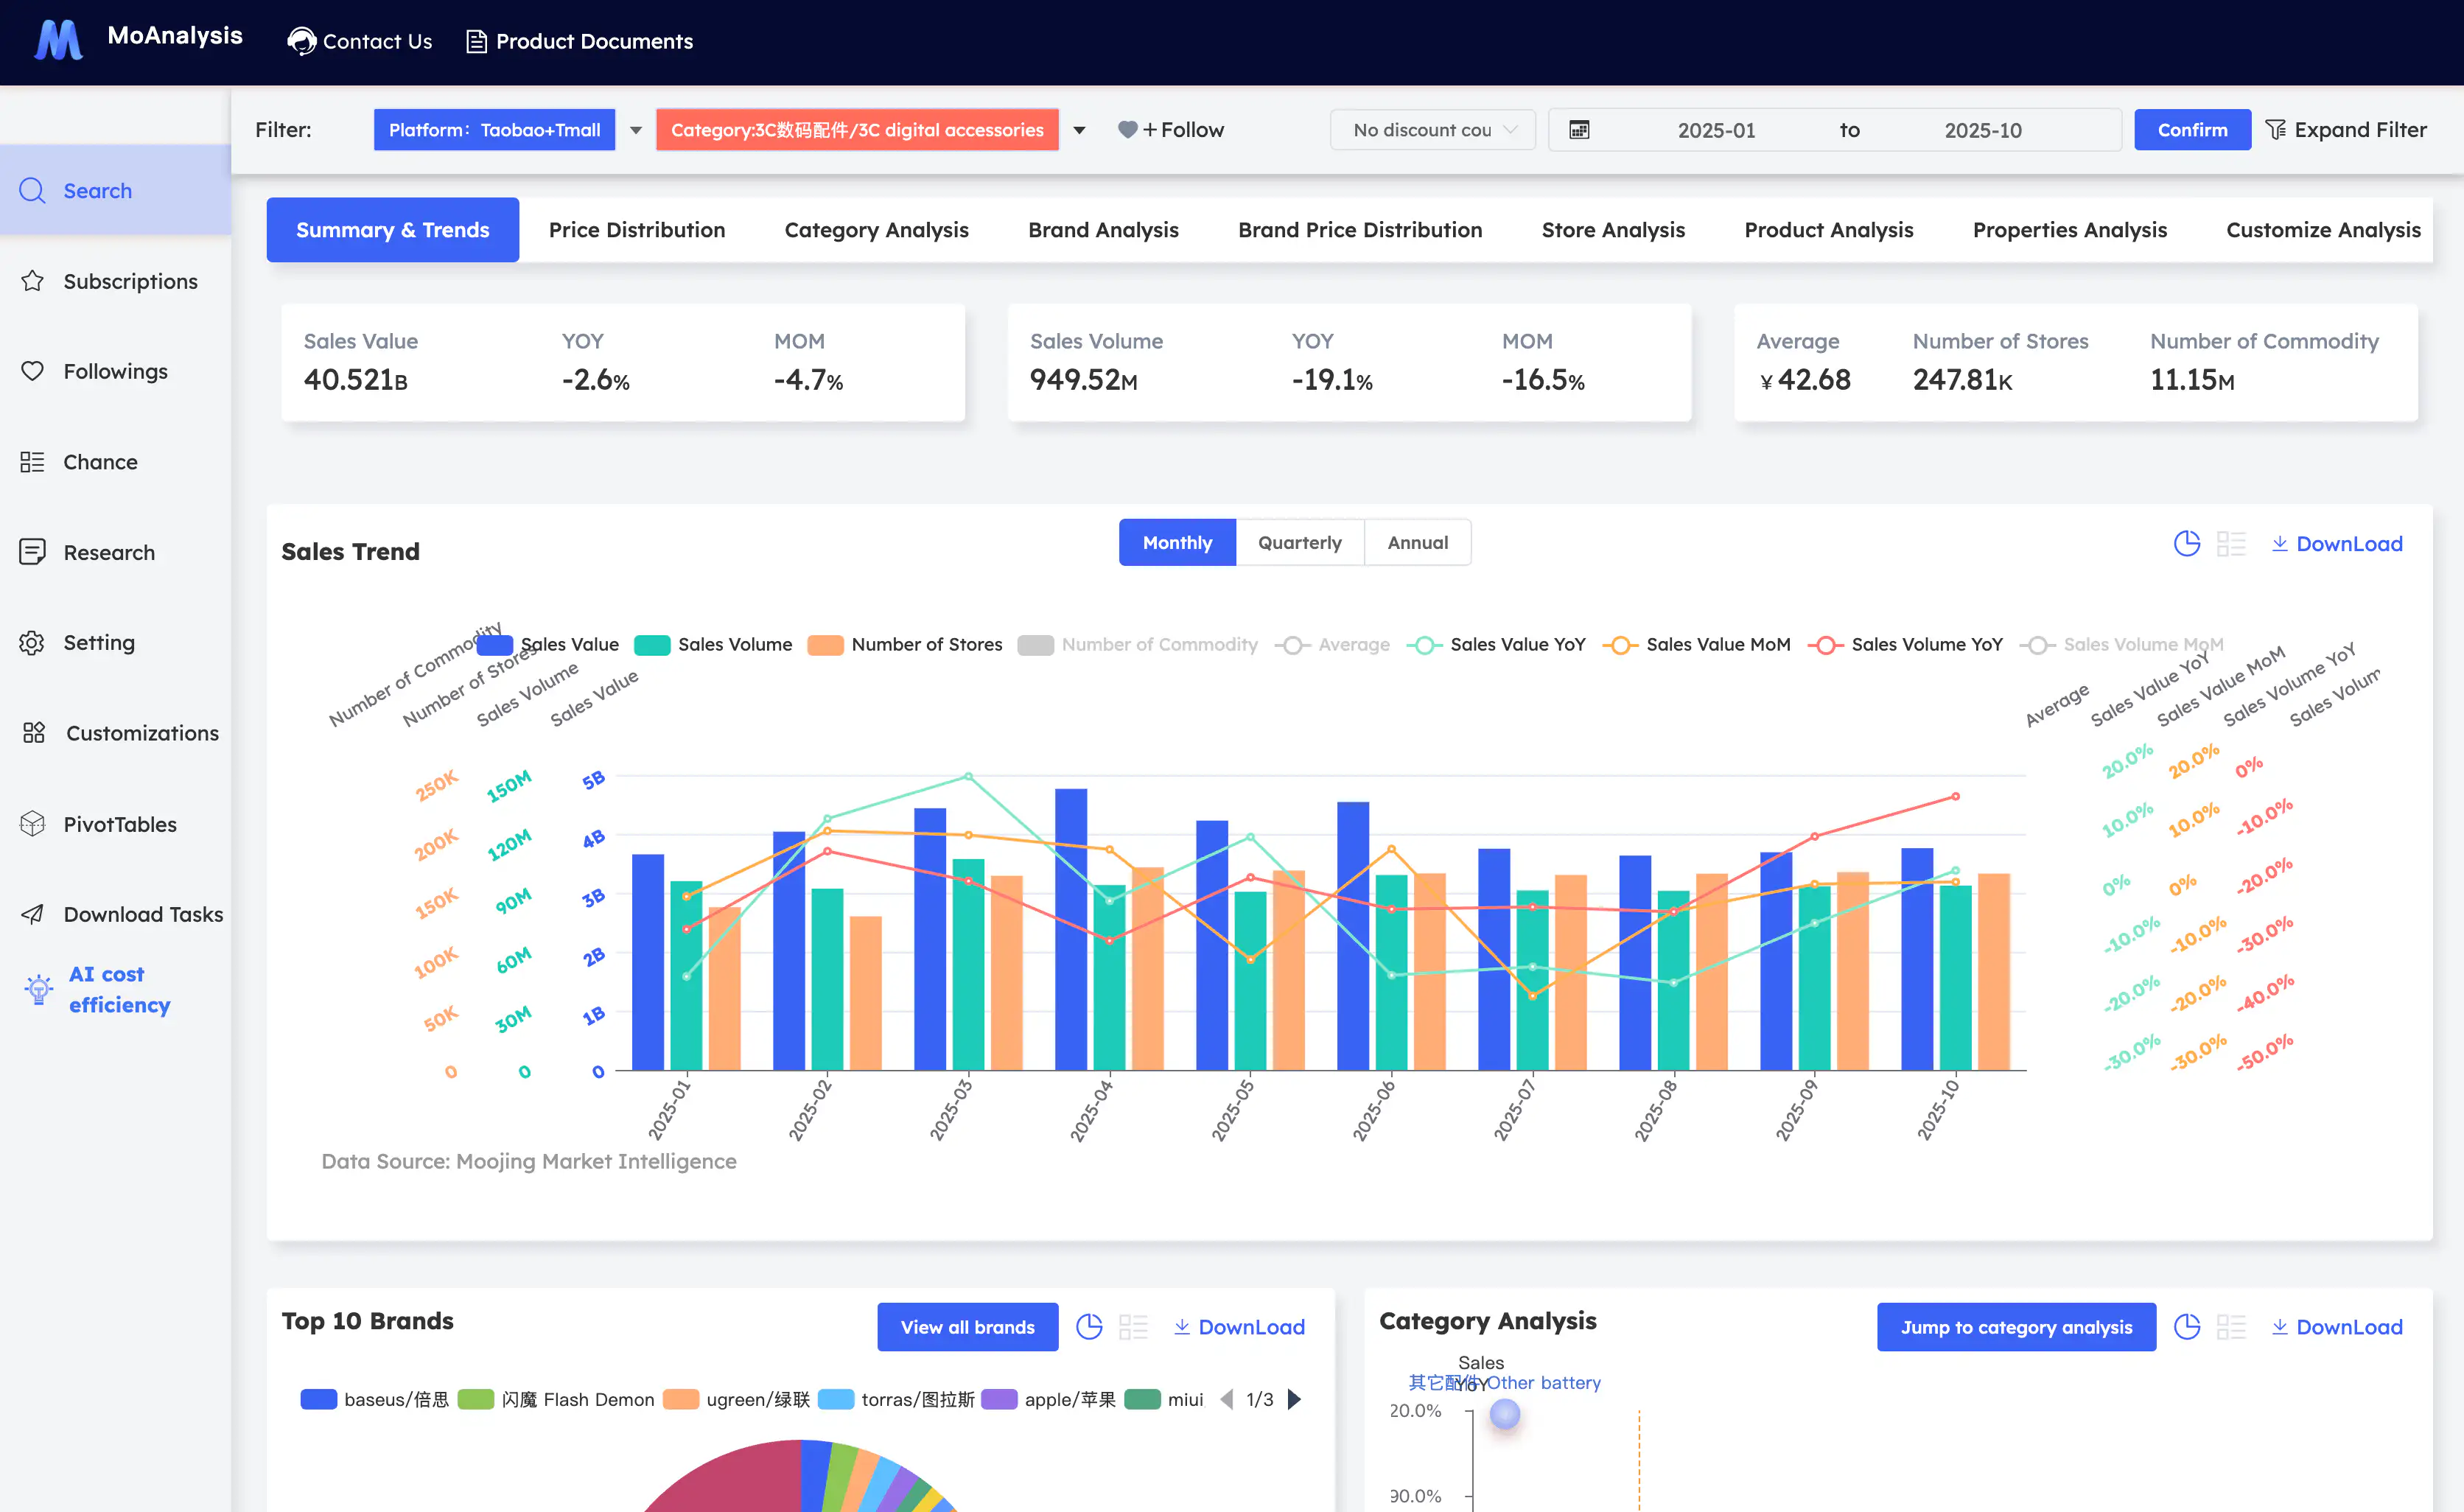
Layer 1 Full Industry Sales“How big is this market — and is it growing?” See total industry sales, seasonal patterns, and growth trajectories so you can size opportunities and set realistic targets.
-
Layer 2 Own Brand Sales“Are we gaining or losing share?” Track your brand’s market share over time, compare channel performance, and spot trends before they show up in quarterly reports.
-
Layer 3 Competitive Brand Sales“What are competitors doing — and should we respond?” Benchmark against top competitors on sales, pricing, and promotions. Spot emerging threats and white space opportunities.
-
Layer 4 Store Sales“Which channels and retailers are driving growth?” Compare flagship stores vs distributors and see which retail partners drive the most volume — so you know where to invest.
-
Layer 5 Product/SKU Sales“Which SKUs should we double down on — or discontinue?” Track sales, reviews, and pricing for every product variant. Identify underperformers and top sellers across your portfolio.
-
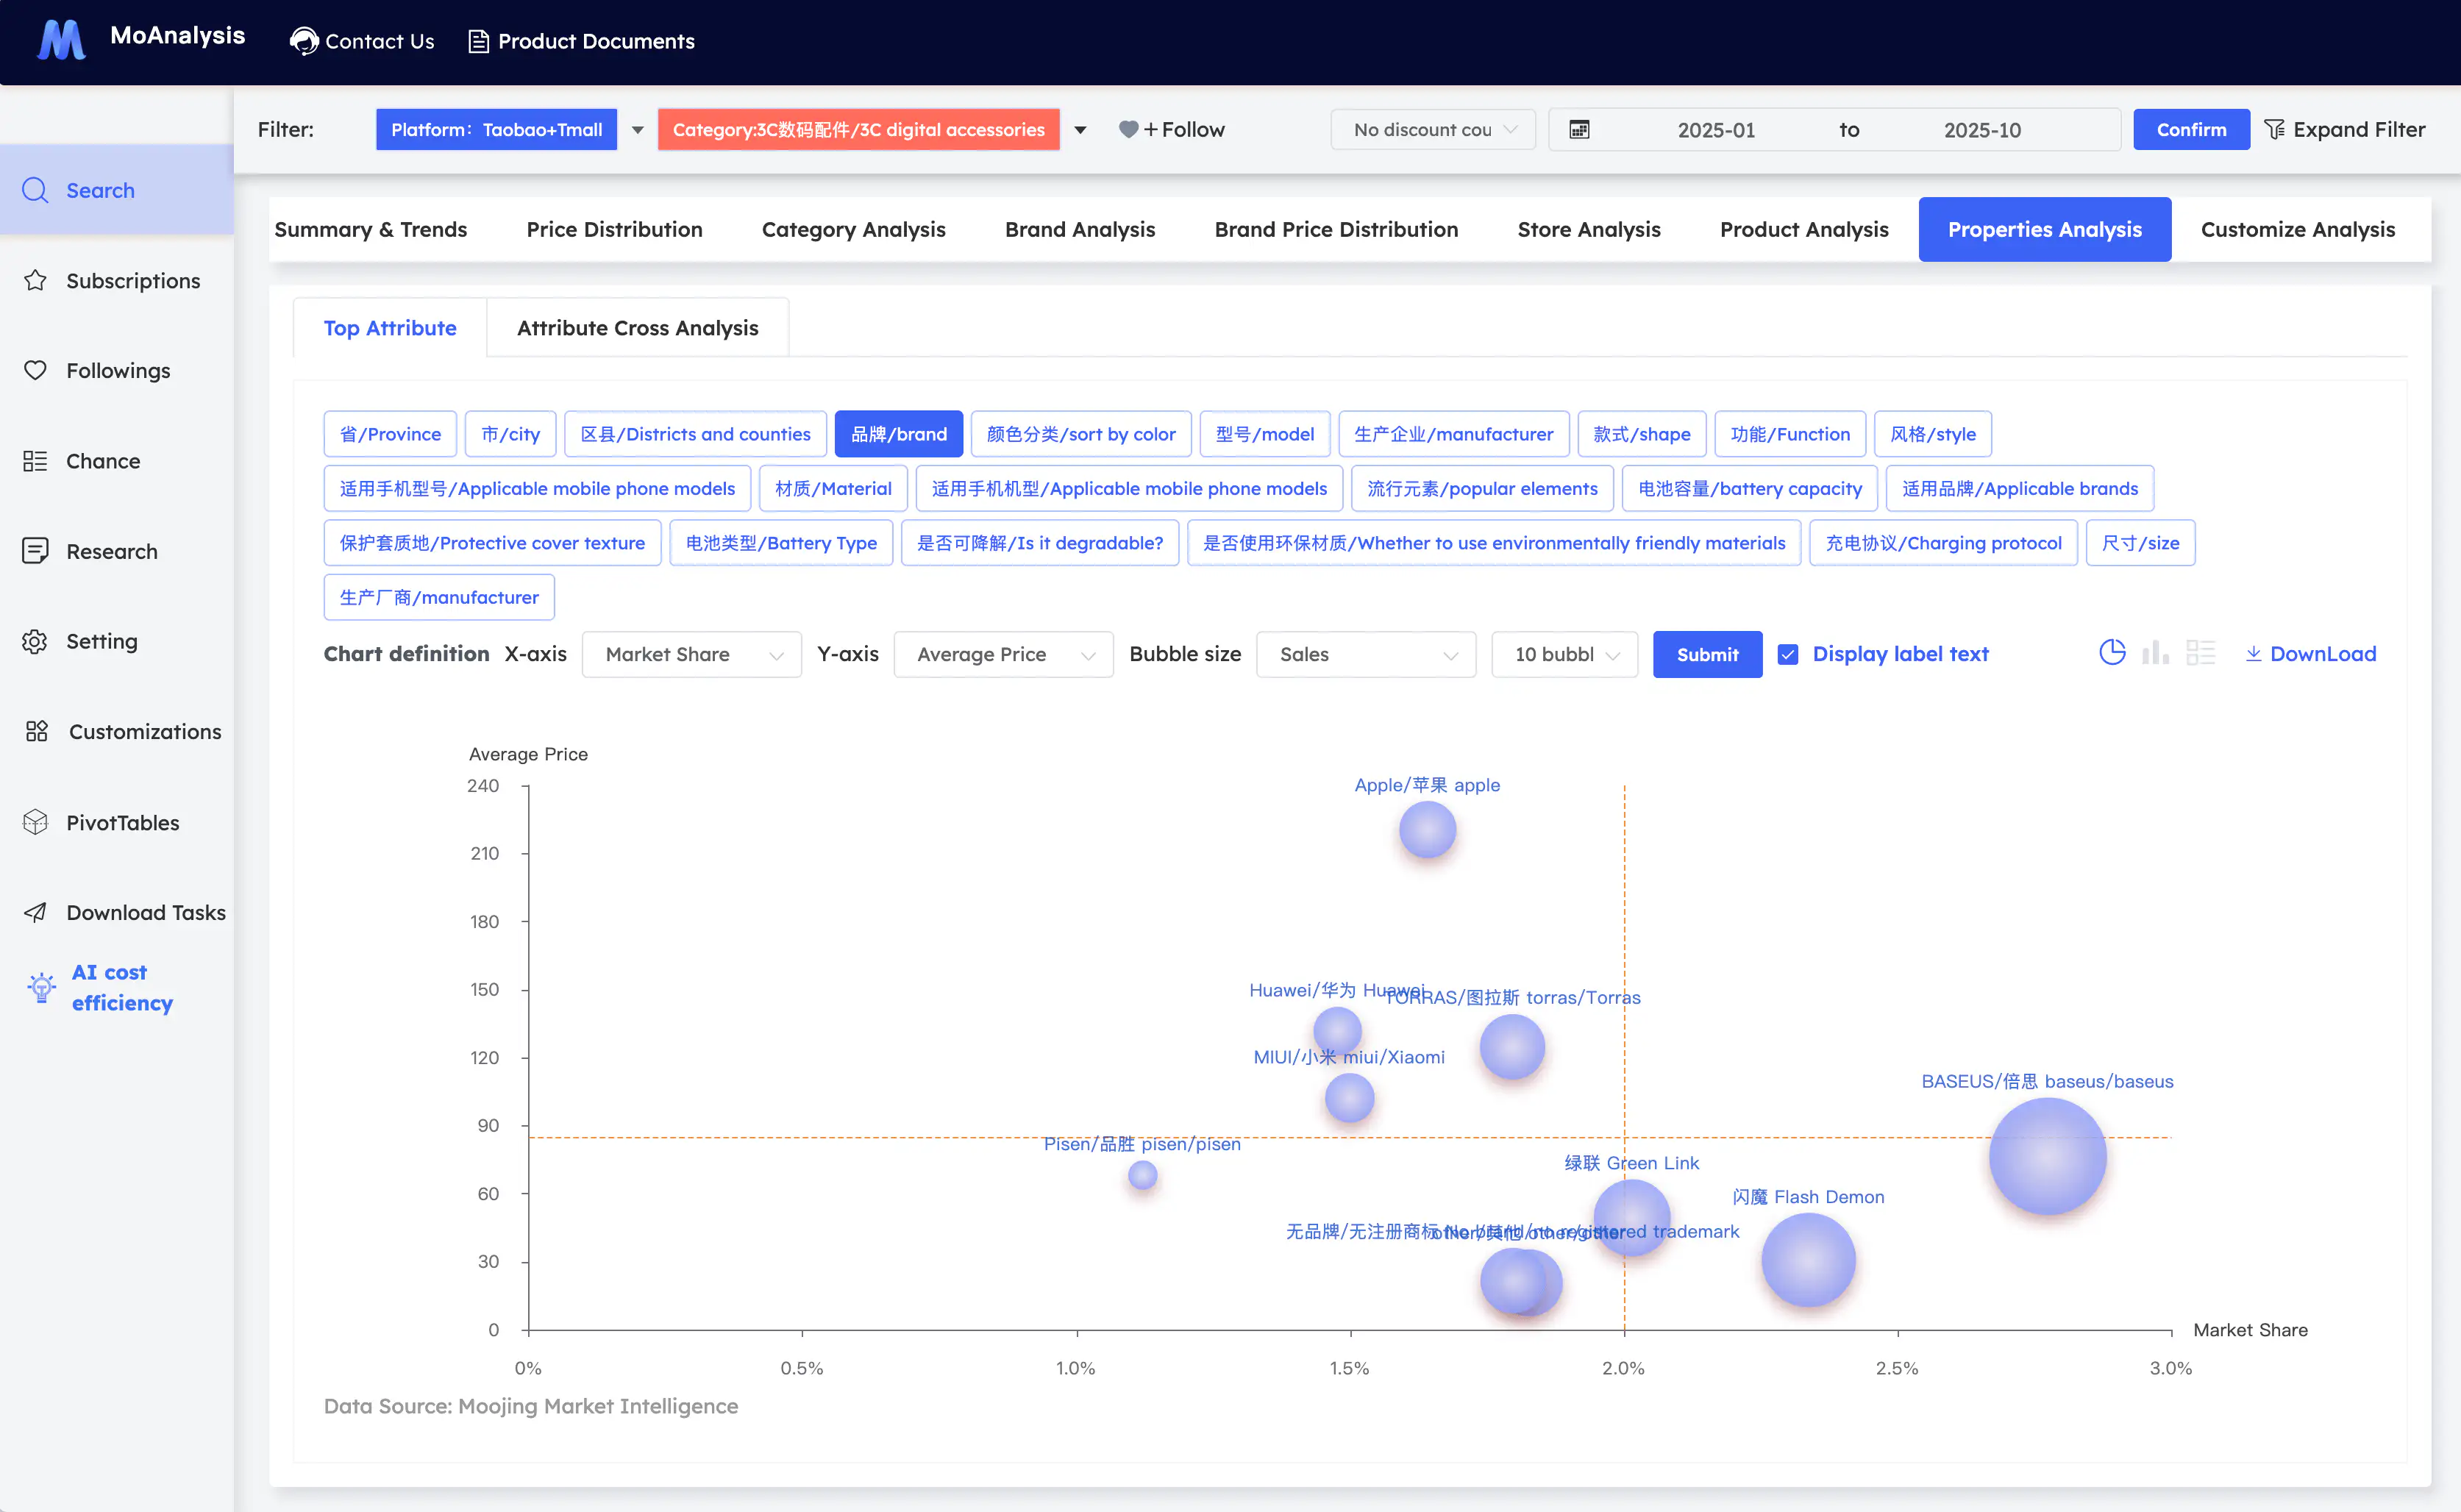
Layer 6 Attribute Sales“What product attributes are consumers actually buying?” See which flavors, sizes, packaging formats, and price tiers are winning — so R&D and innovation teams build what sells.
30+ Platforms Across 20+ Countries
Deep APAC expertise with 10+ years of China market data, now expanding globally.
China E-commerce
All major China e-commerce platforms with 10+ years of historical data and SKU-level granularity.
Social Commerce Platforms
6 Southeast Asian markets, US, Canada, UK, and major European markets with real-time to weekly updates.
International Markets
North America, Europe, Asia-Pacific, Middle East, and Latin America — covering the platforms that matter in each region.
See How You Rank Against Competitors
Tell us your category and we'll send you a sample report showing your competitive position, market sizing, and key trends.
Based on real transaction data across 30+ e-commerce platforms, updated weekly.
- Your market position vs. top competitors
- Category size and growth trajectory
- Key pricing and product attribute trends
Get Your Free Data Sample
See your category data live. No commitment required.
Real-World Application Scenarios
From strategic planning to operational execution — see how leading brands use MoAnalysis to make faster, data-driven decisions.

Discover Untapped Opportunities
Identify trending categories before they saturate. Size your total addressable market and validate new product concepts with real sales data — not surveys.
Drawing from industry-wide and product-attribute sales data across 400K+ brands.
- Spot fast-growing niches early
- Size markets with actual transaction data
- Validate concepts before R&D investment

Respond to Competitors in Just Days
Detect new competitor product launches within days. Track pricing shifts across your category and protect market share before quarterly reports reveal the damage.
Drawing from competitive brand tracking with weekly updates across all major platforms.
- Near real-time competitor tracking
- Pricing and promotion shift alerts
- Market share trend monitoring

De-risk International Market Entry
Compare category potential across 20+ markets before committing resources. Understand local competitive landscapes and identify the right entry timing based on growth trajectories.
Drawing from cross-country category data across 20+ markets with 10+ years of historical depth.
- Cross-country category benchmarking
- Local competitor landscape mapping
- Growth trajectory analysis by market
Also used by:
- Product R&D & Innovation
- Investment & Consulting Analysts
- Operations & Channel Management
Enterprises We've Worked With
Helping leading APAC brands across FMCG, retail, and e-commerce


Brands Using MoAnalysis
See how leading brands transform their market intelligence with MooJing.
Sportswear Brands
How leading sportswear brands use market intelligence in China

Haizheng Pharma
R&D optimization and international expansion with market intelligence

Luolai Home Textiles
8M yuan first-month sales and 42% YoY growth through consumer insights
Complete Your Market Intelligence
MoAnalysis shows you what sells. Combine with these modules to understand why and when .
MoListening
Understand why consumers buy with AI-driven sentiment analysis
MoTrends
Identify when to enter markets with trend detection and blue ocean analysis
MoInsights+
Enterprise API access for programmatic data integration and white-label exports
Frequently Asked Questions
Everything you need to know about MoAnalysis
MoAnalysis is a competitive e-commerce sales monitoring platform by Moojing Global. It tracks over 400,000 brands across 30+ marketplaces in 20+ countries, providing SKU-level sales data, pricing intelligence, and market share analysis with more than 10 years of historical China market data.
MoAnalysis monitors 30+ major e-commerce platforms across 20+ countries, covering all major China e-commerce platforms, leading Southeast Asian marketplaces, and global platforms. Total coverage represents approximately 58-65% of China's total e-commerce GMV.
MoAnalysis provides SKU-level granularity, meaning you can track individual product variants including their sales volume, revenue, pricing, and promotional activity. Data is available at monthly, quarterly, and annual intervals with breakdowns by platform, category, brand, and price tier.
MoAnalysis offers 10+ years of historical e-commerce data for the China market, one of the deepest archives available. This enables long-term trend analysis, seasonal pattern identification, and year-over-year competitive benchmarking.
MoAnalysis is used by brand marketers, product R&D teams, business analysts at market research firms, investment analysts, and consulting firms. Over 500 enterprise clients rely on MoAnalysis for competitive intelligence, including FMCG brands, pharmaceutical companies, electronics manufacturers, and global retailers.
Account provisioning typically completes within a few business days of agreement. Your team receives dashboard access with pre-configured views for your category and competitive set.
See Where You Stand Against Competitors
Get a free competitive benchmark for your category — your market position, growth trends, and pricing intelligence in one report.
Prefer to talk to a specialist? Book a Strategy Call