China Home Appliance Analytics You Can Query Yourself
See SKU-level sales, share, and pricing across China's home-appliance market, on demand.
Used by 500+ enterprise brands to validate or replace their market intelligence.
Prefer a customised report? Request a free data sample
 SKU-level data
The data behind the dashboards
Trusted by leading global brands
Appliance, FMCG, retail, and e-commerce teams use Moojing to analyse China categories




















What does a China home-appliance dashboard show?
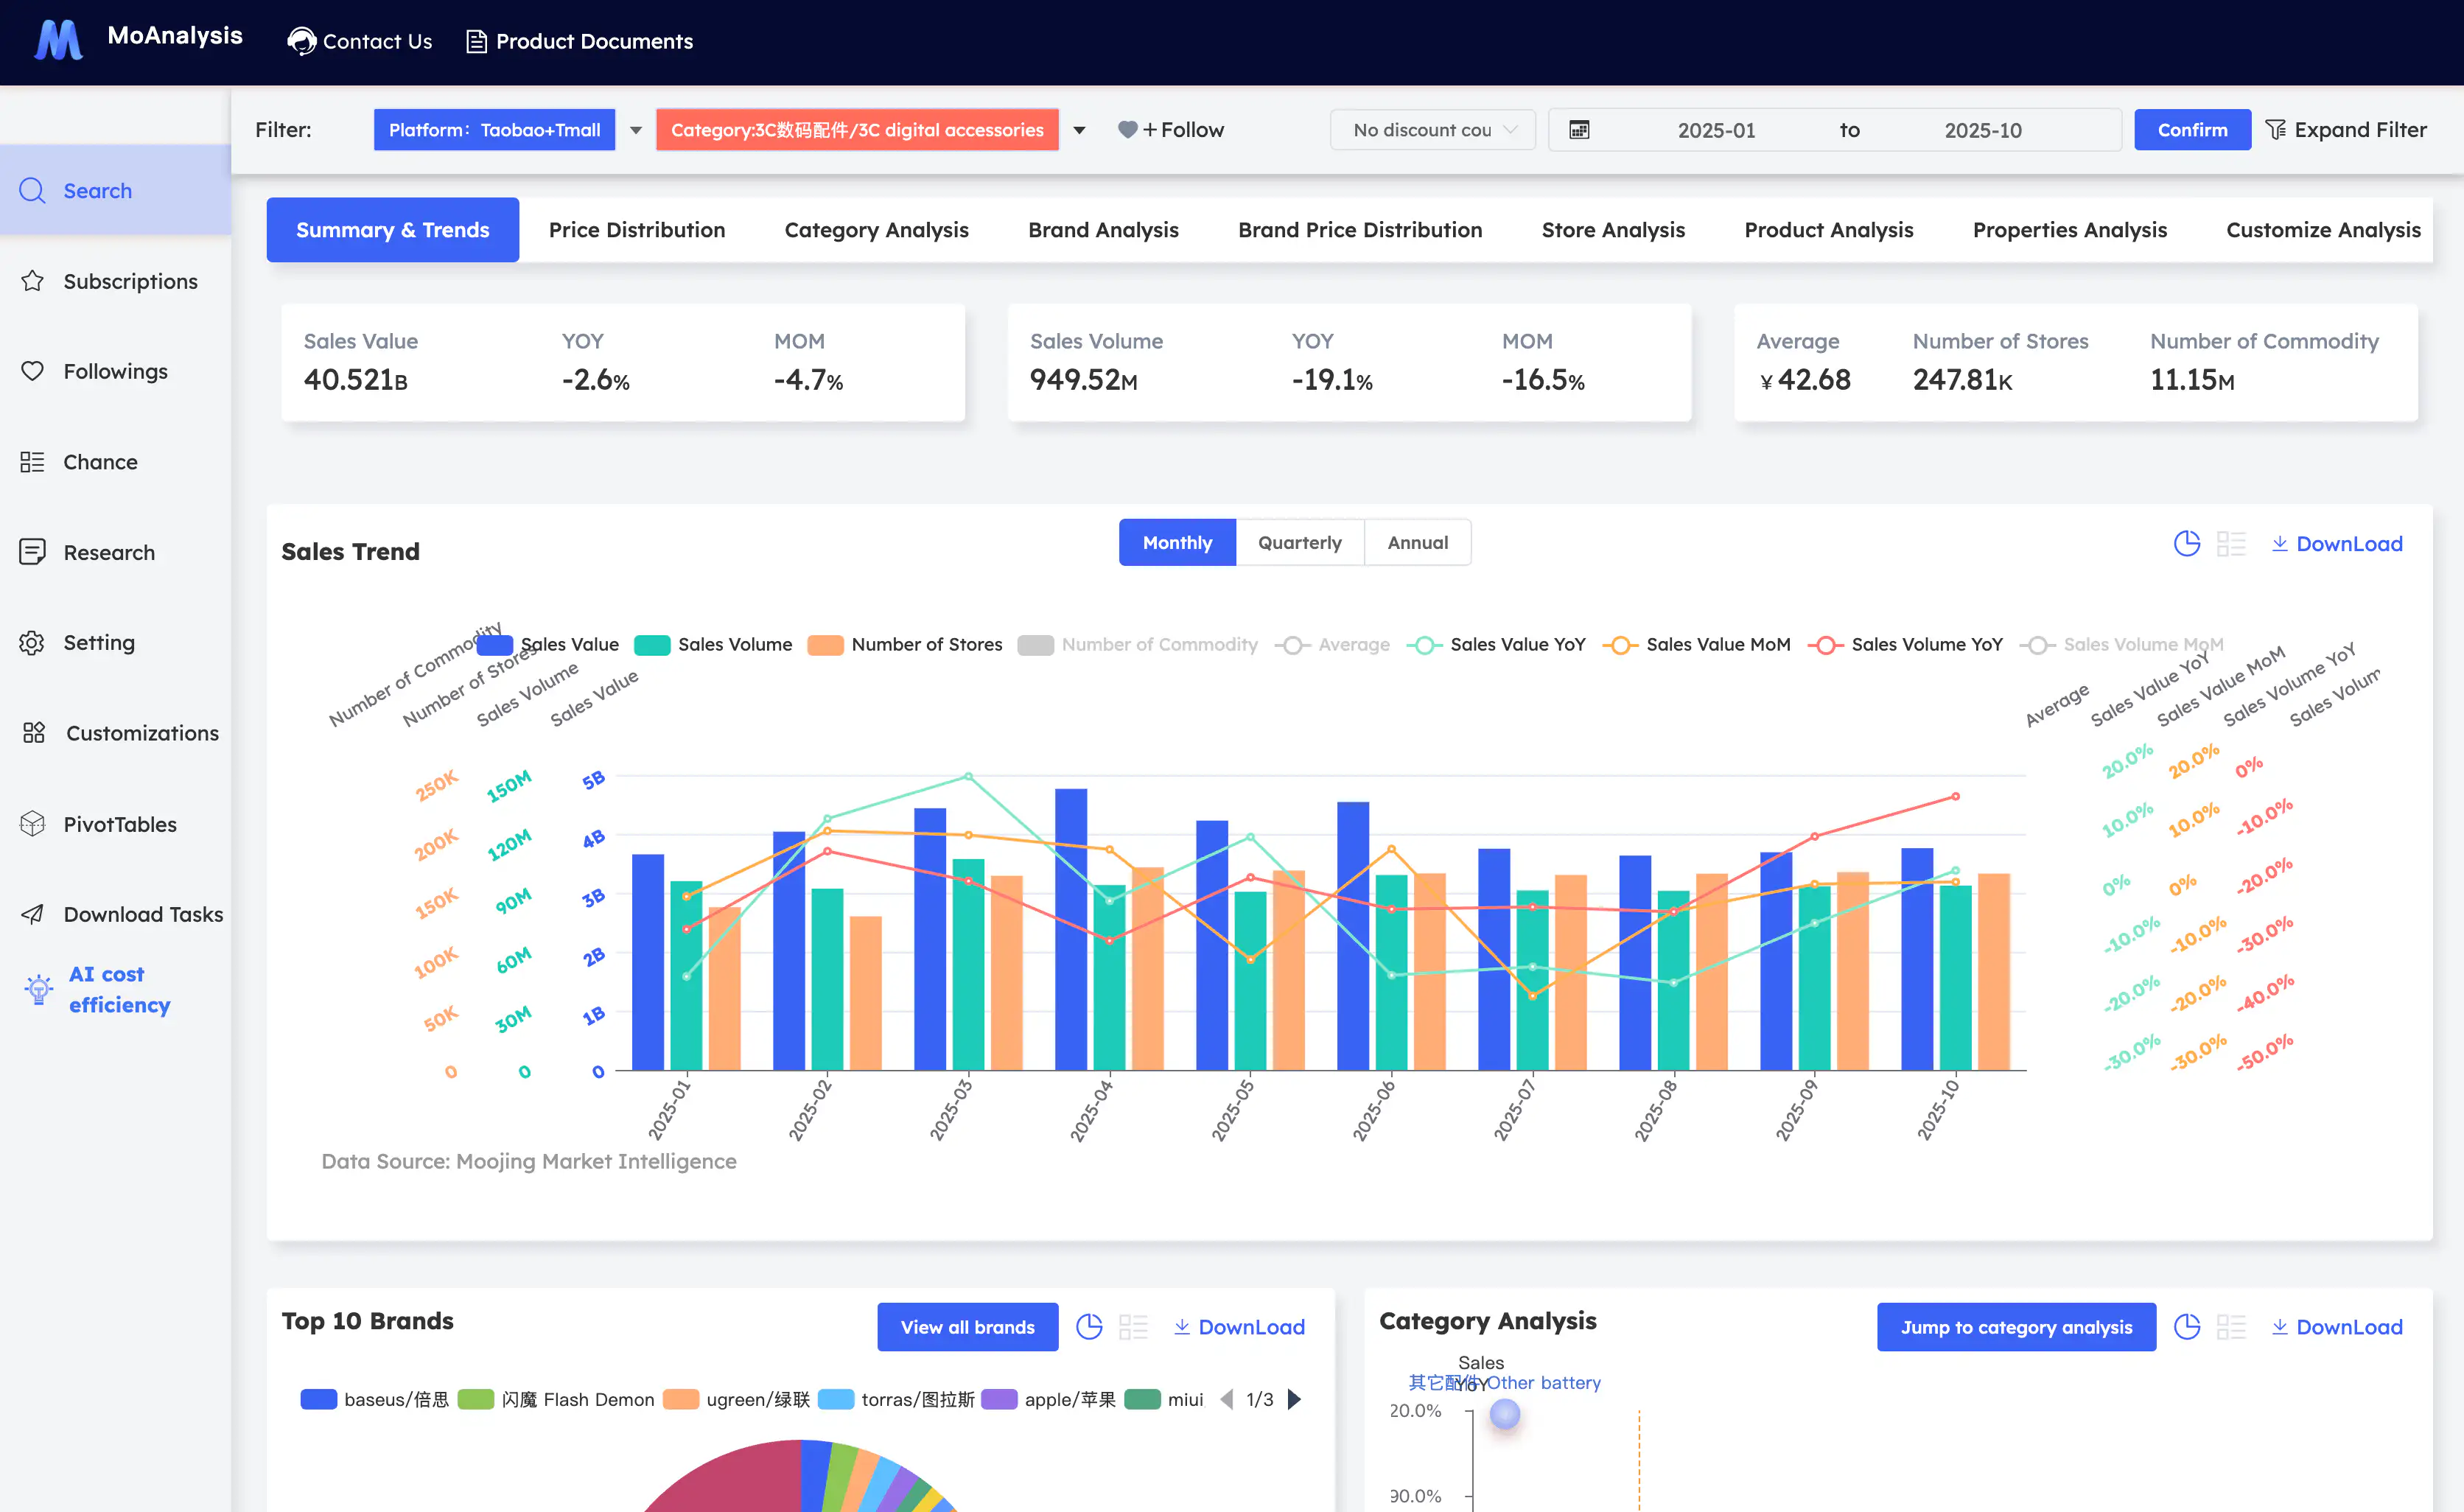
Every view below is a real MoAnalysis dashboard you can filter by subcategory, brand, platform, and period. Start from the headline trend and drill all the way to the SKU.
See which appliance subcategories and brands are winning.
Compare large appliances, kitchen appliances, and small appliances side by side to see who is gaining share, which platforms drive it, and how momentum has shifted across the last ten years.
-
Category and subcategory growth at a glance
-
Brand and SKU share, ranked and trended
-
Split by major e-commerce platform
Updated monthly
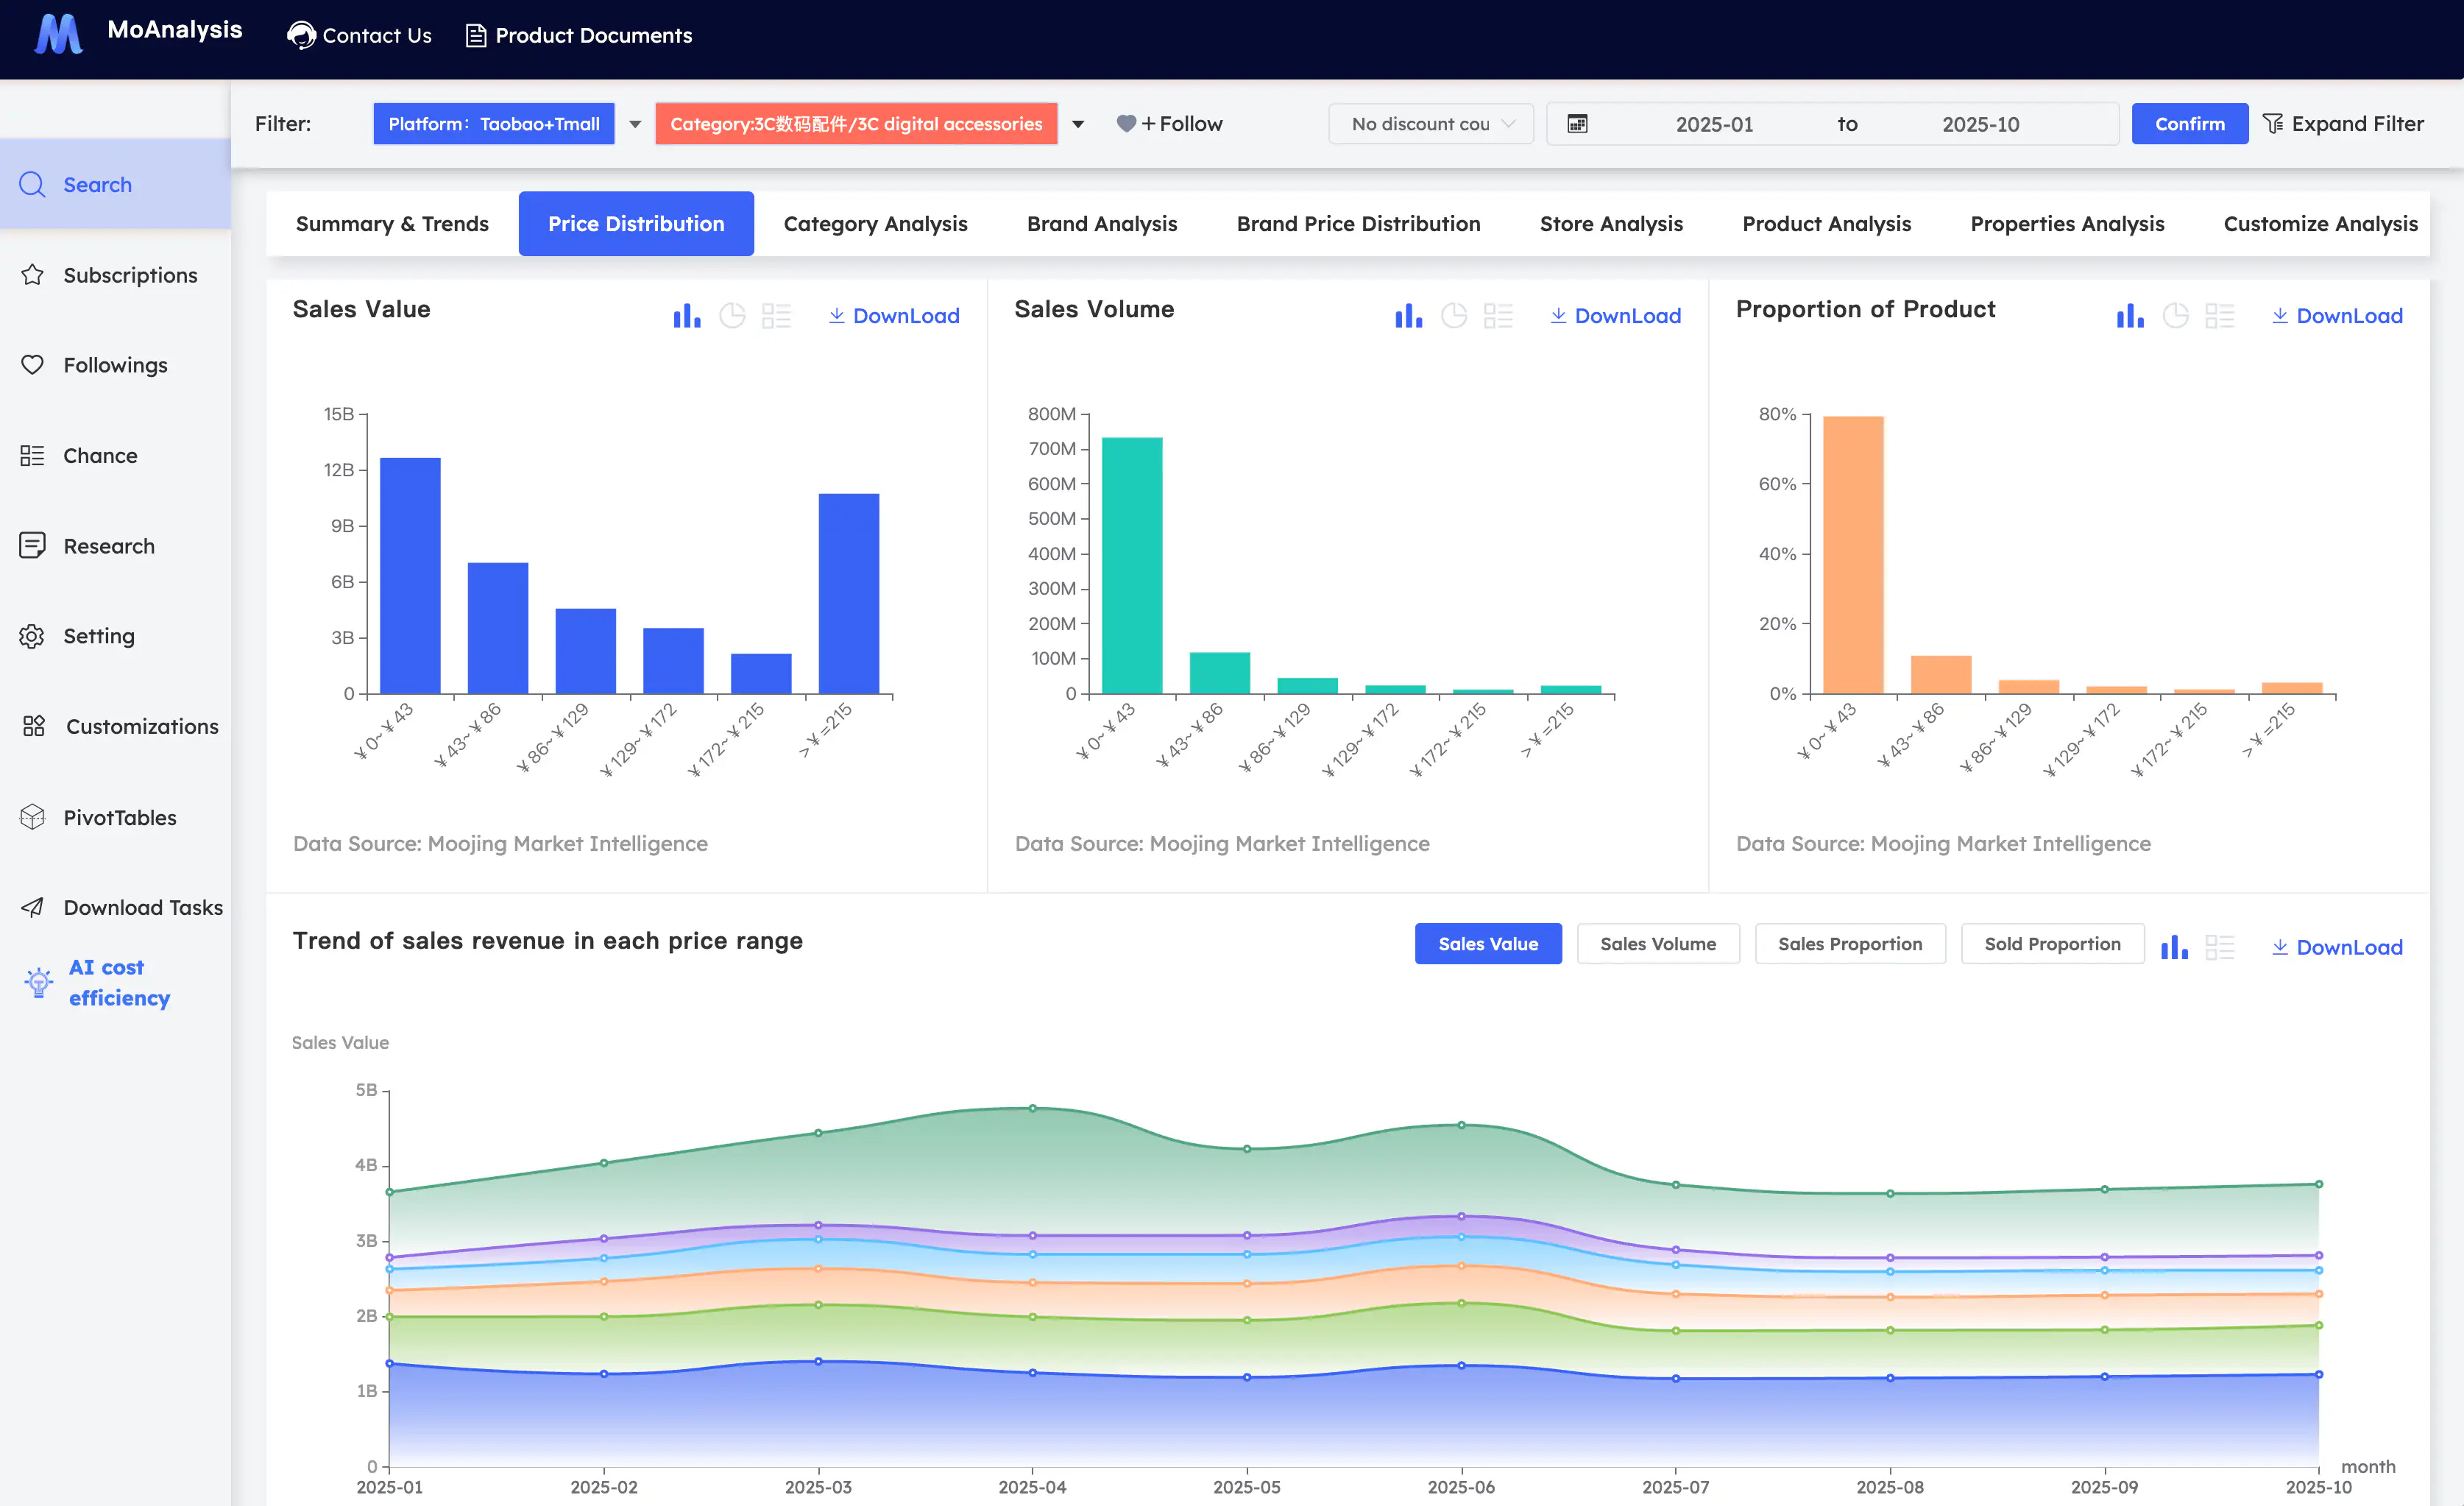
See where demand sits on the price ladder.
Price-band distribution shows where volume and value concentrate, how premium and mass are moving, and where your price ladder lands against the competition.
-
Sales value and volume by price band
-
Premiumisation and discount trends over time
-
Benchmark your price positioning against rivals
 30+ marketplaces
Can I ask MoAI about my category in plain English?
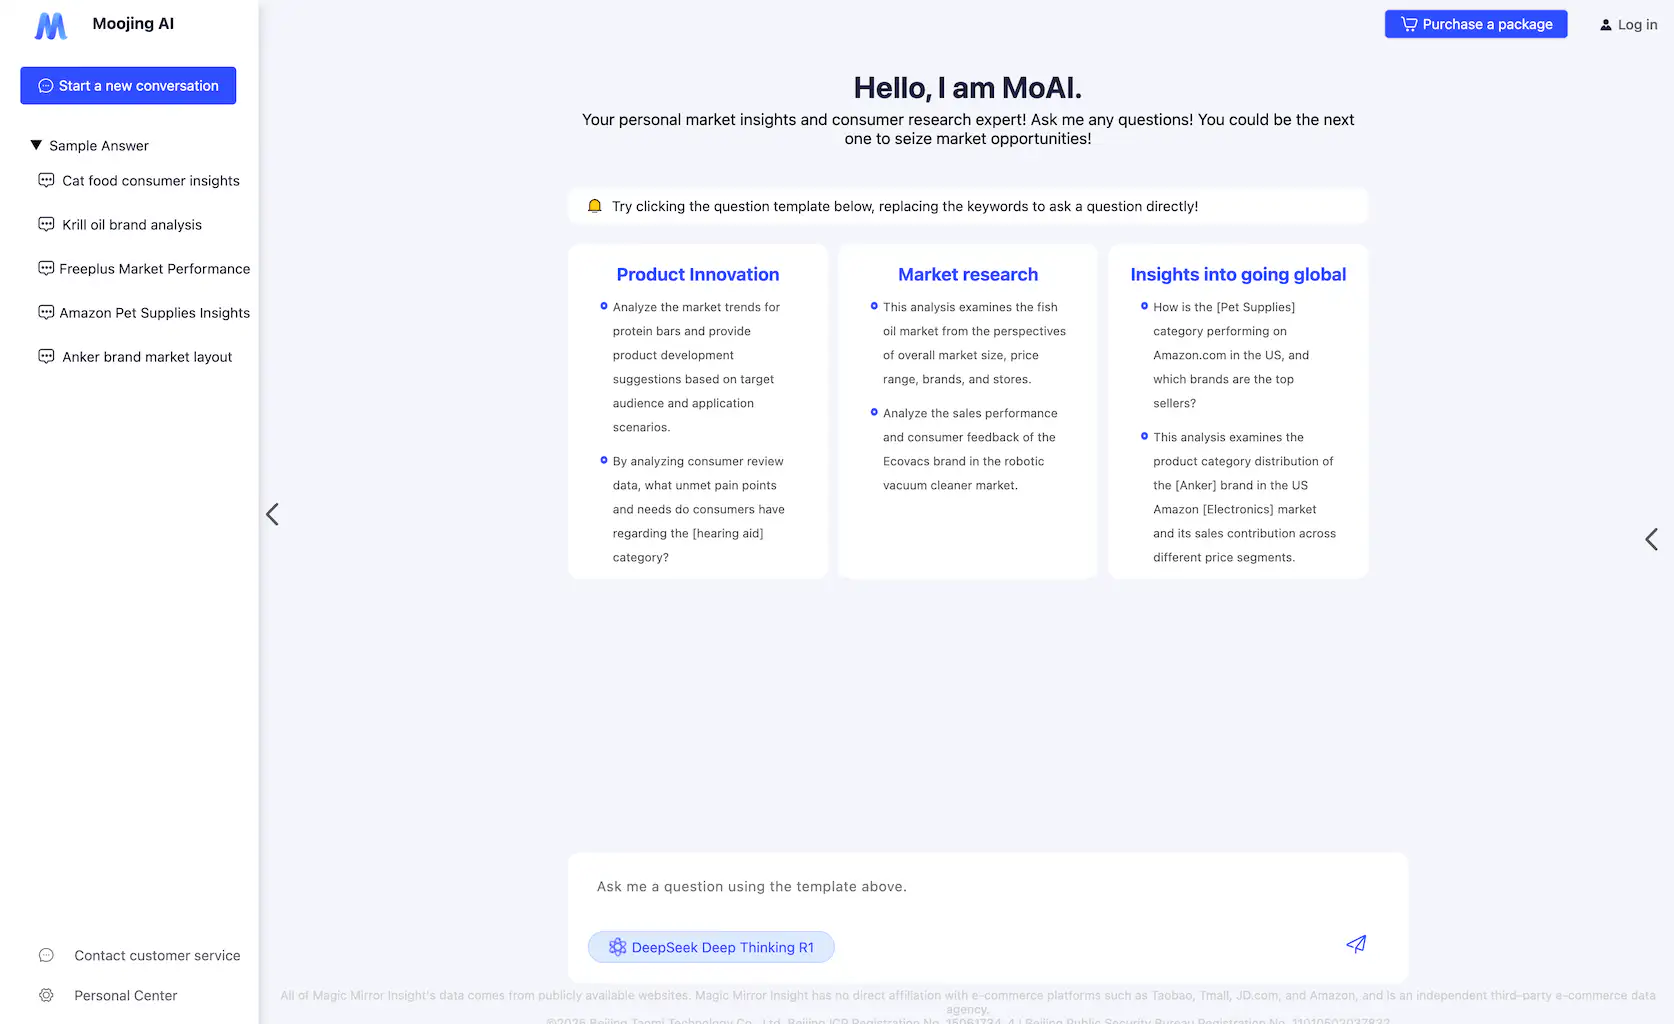
Yes. Type your question and MoAI returns a sourced, queryable answer backed by real sales and consumer data, then you keep asking follow-ups yourself.
Prefer a customised report?
Get a free data sample for your specific appliance category, period, and market.
How does self-serve market data compare with commissioned research?
You get the same e-commerce analytics that power leading industry reports on China home appliances, but interactive, self-serve, and without the weeks-long wait or the consulting markup.
| Feature | Commissioned research | Moojing platform |
|---|---|---|
| Time to an answer | Weeks of analyst back-and-forth | Minutes — query the dashboards or ask MoAI |
| Depth | A static slide deck for one question | SKU-level sales, pricing & share you can re-cut |
| Freshness | A snapshot, dated on delivery | Monthly updates across 30+ marketplaces |
| Follow-up questions | A new engagement and invoice | Self-service — ask the next question yourself |
Are the home-appliance reports built on the same data?
Yes. These reports are built on the same MoAnalysis data. Read them as a primer, then open the platform to cut the numbers for your own brand, subcategory, and period.
- Every report is sourced from the same SKU-level data you get in the platform.
- Use the report to frame the question, then drill into your own brand and subcategory live.
- You can re-cut the data by platform, price band, or quarter yourself, with no waiting on an analyst.
Reports for this category
How do home-appliance teams use China market data?
Expansion, category, competitor-analysis and pricing teams use it for market-entry planning, subcategory analysis, share benchmarking, pricing and promotion analysis, channel prioritisation and quarterly reviews.
Market-entry planning
Size China appliance subcategories and channels before you commit.
Category and subcategory analysis
See where large, kitchen, and small appliances are heading.
Competitor and share benchmarking
See who is gaining share at brand and SKU level.
Pricing and promotion analysis
Analyse price bands, premiumisation, and discount depth.
Channel prioritisation
Compare performance across major e-commerce platforms for your category.
Quarterly category reviews
Refresh the same view every quarter without a new engagement.
Trusted by 500+ enterprises across FMCG, pharma & retail
“Consumer electronics products are evolving faster than ever, with features becoming increasingly refined and innovative. Brands need to conduct accurate, objective market research and user-need analysis ahead of time to drive product iteration and adapt channel strategies. Moojing is an indispensable analytical tool for this.”

Kathy
Head of Business Analysis, NetEase Youdao
“Moojing's combination of e-commerce sales insights and consumer review analysis effectively helps us spot market opportunities early and design one hit product after another.”

Yingjie Sun
CEO, PINWU Design
“Through its multi-dimensional market intelligence, Moojing continuously captures shifts in market trends, effectively revealing the future of China's consumer landscape and helping us better support the rise of Chinese brands.”

Yang Xiao
CEO, Xiaofeijie
Try it on your home-appliance category
Start a free trial — self-serve dashboards with your large, kitchen, or small-appliance data, ready in days. No long onboarding, no complex setup.
Questions about China home-appliance market intelligence
Moojing is a self-service China e-commerce analytics platform. You query SKU-level sales, pricing, and consumer data through interactive MoAnalysis dashboards, or you ask MoAI in plain English. The downloadable reports are free primers built on the same data, and the data sample is a fast way to see your specific category before you start a trial.
You can see sales, market share, pricing, and consumer signals across large appliances, kitchen appliances, and small appliances, broken down by brand, subcategory, major e-commerce platform, and time period, with China history going back to 2016 to compare against.
Moojing is a subscription scoped to the categories, markets and access your team needs. Pricing is not published. Start a free trial or request a free data sample to see your home-appliance category first.
Yes. Brand, category, e-commerce, and strategy teams use it to size appliance subcategories, benchmark competitors, and pressure-test pricing before and after entering China.
Start a free trial to get hands-on access to self-serve dashboards for your category, or request a free data sample if you would rather see your specific category, period, and market first. Our team responds within 3 business days.
Yes. Where a report is available, use the report CTA to download it through the existing report-download flow. It is a useful primer before you open the platform.