Two Categories, One Aisle: What China's Baby Care Shoppers Actually Pay For
 By Quan Wenjun
6 min read
By Quan Wenjun
6 min read
Executive Summary#
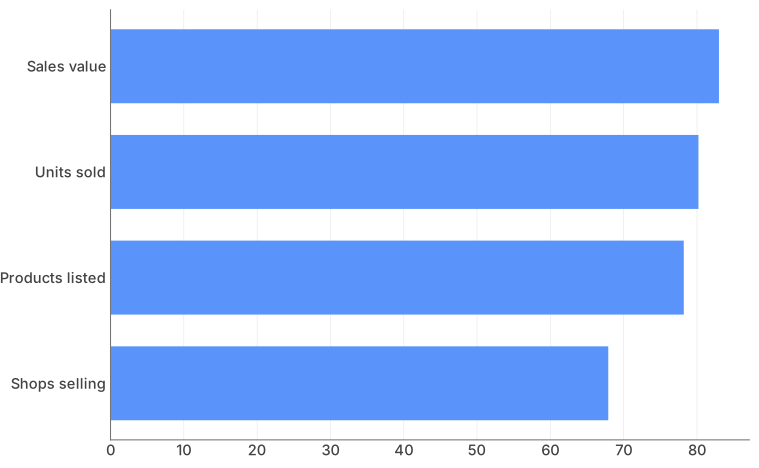
Baby skincare and baby bath sit on the same shelf, in the same basket, bought by the same parent — and they behave like two different categories. Moojing's analysis of a leading China marketplace, January to May 2026, covering products marketed on hypoallergenic, soothing, repair, barrier, gentle or sensitive-skin positioning, puts skincare at CN¥ 518M (USD 71.9M)** against bath at **CN¥ 106M (USD 14.7M): 83.0% of the money for 80.2% of the units. Skincare grew +13.4% year on year, bath +6.8% — roughly twice the rate. It carries a higher average price, CN¥ 80.5 (USD 11.20)** against **CN¥ 66.9 (USD 9.30), and it supports more than twice the brands.
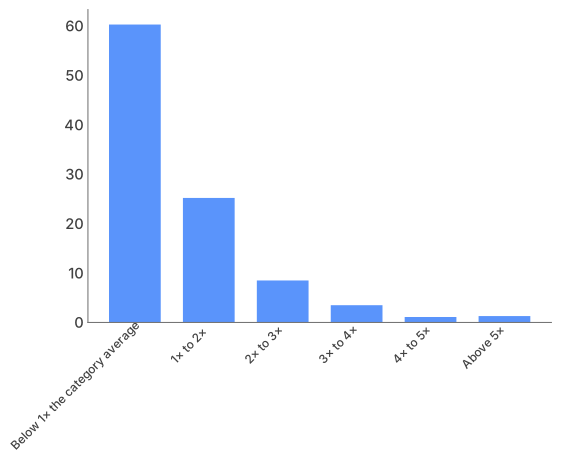
The instinct that follows is that bath is the commodity half and skincare is where trading up happens. The price ladders say otherwise. Measured against each category's own average price, the share of purchases sitting above twice that average is 14.4% in skincare and 13.9% in bath — effectively the same. Parents trade up in bath in the same proportion as they do in skincare. The pot is a fifth the size; the shape of it is not different.
The Split Is Wider Than the Shelf Suggests#
Every structural measure in the dataset points the same way — but not by the same margin, and the way the margin narrows is the interesting part.
Baby skincare's share of the two categories combined, on four measures
Both Halves Trade Up by the Same Amount#
The two categories price differently in absolute terms — skincare averages CN¥ 80.5 (USD 11.20)**, bath **CN¥ 66.9 (USD 9.30), a 20% gap. The natural reading is that skincare is where a premium proposition works and bath is where it does not.
The value distributions do not support that reading. Set each category's ladder against its own average price rather than against the other's, and the two are close to identical.
Share of products sold by price band, indexed to each category's own average price
The Sellers Are Spread More Evenly Than the Money#
Skincare carries 2.2× bath's brand count and 3.6× its product count — but 4.9× its sales value. The revenue attaching to each listing is therefore higher in skincare: roughly CN¥ 76,400 per product listed over the five months, against CN¥ 56,100 in bath, about 1.4×.
Brands behave differently across the two as well. A skincare brand lists 9.6 products on average; a bath brand lists 5.9. Skincare's shelf is deeper per brand and better paid per line.
The uncomfortable arithmetic is on the bath side. It has 32.1% of the shops and 21.8% of the listings for 17.0% of the money, at the lower revenue per listing of the two. That is a category where the number of sellers has run ahead of the value available to them.
What This Changes#
Three things follow for anyone planning into this aisle.
Do not price bath as the budget half. The premium share of purchases is the same in both categories once each is measured against its own average. A bath product at CN¥ 134 (USD 19)** occupies the same relative position as a skincare product at **CN¥ 162 (USD 23), and the same proportion of purchases sits above it.
Treat the two as separate plans, not one baby-care plan. They differ by 2× on growth, by 20% on average price, by 2.2× on brand count and by 4.9× on value. A single strategy calibrated to the blended figures will be wrong for both halves.
In bath, the bottom band is where the competition already is. About a third of the aisle's seller entries work a category holding a sixth of its money, and the bottom band alone accounts for 56.9% of bath's units. This does not settle where a new product should sit, which the data cannot answer — but an entry at the bottom joins the most crowded part of the smaller half.
What the data does not tell you is which of these categories a given shopper prioritises when the basket is tight, or whether the premium bath share is being served well or merely served. Those are questions for a different dataset. What it does establish is that the premium buyer exists in both halves, in the same proportion, and that the two halves have been planned as though she does not.
Methodology#
Analysis based on Moojing Market Intelligence data from a leading China marketplace, January to May 2026. The selection covers products marketed on hypoallergenic, soothing, repair, barrier, gentle or sensitive-skin positioning. That is a selection on how products are presented and sold, and nothing here is an assessment of what any product does. Share and value figures are for the two categories as defined above and are not a measure of the whole China baby care market. Price bands are the source's own; the normalised view restates them as multiples of each category's rounded average selling price, which is how the source's band edges are set. The source does not label the basis of its price-band share column. It is read here as a share of products sold, because a sales-value basis is ruled out by the source's own figures — three of its top-selling skincare products sit inside a single band and between them are worth more than twice that band's entire value on a value reading, while a unit reading accommodates them — and because a unit basis reconciles with the category's average selling price. Shares above a threshold are summed from the source's own band rows rather than taken from its summary captions, which do not reconcile with them. Growth is used only as the category-level pair. The source also publishes a year-on-year rate for each individual band; those are not used, because weighting them by their own shares implies category growth of roughly +28% and +33% against the +13.4% and +6.8% the same source states, and the two cannot both be right. Product, brand and shop counts are per category: a seller listing in both is counted in both, so the split describes category-level seller entries rather than distinct businesses. USD figures are converted at CN¥ 7.2 = USD 1 and are indicative. No forecast is made from this data.
This content adheres to Moojing's editorial standards .


