Where the Money Actually Is in the US and UK Hairdryer Market
 By Jotham Lim
6 min read
By Jotham Lim
6 min read
Executive Summary#
Get the Full Report: Download the complete analysis for detailed data, methodology, and pages of insights.
Hairdryer listings and hairdryer revenue map to different places, and a brand that benchmarks against listings enters the wrong market. Over the two years to May 2026 the US category turned over $889M (CN¥ 6.44B) and the UK $127M (CN¥ 920M). Entry products under $50 take 62.0% of US listings but 39.1% of revenue; the flagship tier above $249 takes 3.1% of listings and 15.8% — roughly 8× the revenue per product. The entry question is which rung of the ladder you build for.
Two Markets, Two Very Different Sizes#
The US category generated $889M over 24 months to May 2026, at an average selling price of $49 across 6,578 products; the UK generated $127M at $43 across 2,079, for 8,657 products on sale. The US is roughly seven times the UK by revenue and runs the higher average price.
Both totals are corroborated by an independent cut of the same data: the price-band tables below sum to $890M and $128M, reaching the same figures by a different route.
We publish no category growth rate. The source states one, but its own monthly series covers 23 of the 24 months and does not reproduce it, and nothing in the data resolves which is right. Rather than print a figure our own chart contradicts, we omit it. Cohort- and archetype-level growth is separately sourced and reported throughout.
The Listing Map and the Revenue Map Diverge#
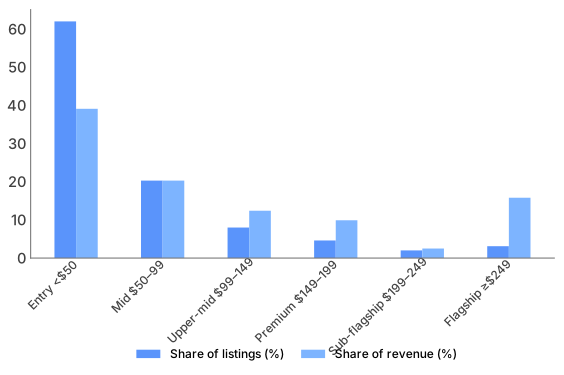
Entry products below $50 (CN¥ 360) account for 62.0% of US products on sale but 39.1% of revenue — $348M — while the flagship tier at $249 (CN¥ 1,804) and above takes 3.1% of products and 15.8%, or $141M. The mid band at $50–99 sits exactly in line at 20.3% of both; each band between $99 and $199 earns more revenue share than listing share.
The UK skews further toward entry assortment — 70.6% of listings under $44, earning 43.0% of revenue — while its flagship tier above $223 delivers 10.8% of revenue from 2.4% of products and its premium band at $134–178 delivers 11.8% from 3.1%.
A brand that matches its assortment to the listing map competes where the products are, not where the money is.
Share of listings versus share of revenue, US hairdryer price ladder
Read the Field as Archetypes, Not a Ranking#
US revenue sorts into archetypes rather than a ranking: premium technology holds 17.7% at $160–$412, mass heritage and beauty 17.1% at $23–$29, growing +10–33%, emerging DTC 5.2% at around $33, growing above +40%, professional salon 4.2% at around $91, and a long tail of 46.3%.
The UK is arranged differently: heritage and professional tools lead at 28.0% of revenue at $30–$41, growing +10–65%, ahead of premium haircare and technology at 21.7% and $132–$366; emerging challengers take 2.1% at around $113, growing above +50%, with a 37.4% long tail.
On the only measure these tables support, the US is the less consolidated of the two: its top two archetypes take 34.8% of revenue against 49.7% in the UK, and its long tail is 46.3% against 37.4%. Both cuts point the same way, which makes the US — already seven times the size — the better first market on this data. Premium demand also looks to be migrating rather than shrinking: the premium-technology tier reaches around $412 (CN¥ 2,985) and is broadly flat, while specification-comparable alternatives around $120–$160 grow.
The Corridor Where Challengers Are Growing#
Export challengers are established here, not experimental: they hold roughly 6.0% of the US market across the brands broken out individually, with the wider cohort estimated at 7–8%. Their growth is reported per brand, and the range is wide.
They run two strategies. The volume route sits at $35–$43 (CN¥ 251–314), has generated around $41M of US revenue, and grows in a +27% to +190% range on power, low noise and multi-attachment sets. The specification-parity route sits at around $120 (CN¥ 870), has generated around $13M, grows at +7%, and sells premium-equivalent specification at roughly a third of premium price.
Both routes working at once suggests a structural opening rather than a temporary pricing gap. The open corridor for a new entrant is $35–$120 (CN¥ 250–870); the contested ground is $97–$193. Capability is no longer what constrains the parity route — the specification gap has largely closed. The natural next inference is that brand awareness is what limits challenger share, and it is the parity cohort's own stated risk, but nothing in this dataset measures awareness or review depth. Treat it as the hypothesis to test before it is the thing you fund.
What the Revenue-Leading Products Look Like#
The US volume leader is a curl-specific dryer sold with a diffuser in a five-piece set, at over 1.0M units — attachment sets turn a commodity purchase into a use-case purchase. All-in-one formats grow fastest, and hair-health framing outperforms power framing. Three technology directions carry the category into 2026: heat-free drying, the high-speed brushless motor at 110,000 RPM and the multi-styler all-in-one. The UK mix skews professional, led by salon-grade positioning above $138 (CN¥ 1,000); the US skews value-led.
Key Takeaways#
- Benchmark against revenue share, not product counts — entry is 62.0% of US listings, 39.1% of revenue; flagship 3.1% and 15.8%.
- Enter in the $35–$120 (CN¥ 250–870) corridor, where the export cohort grows fastest; $97–$193 is contested.
- Lead with the US, not the UK — roughly seven times the revenue and the less consolidated of the two (34.8% against 49.7% in the top two archetypes).
- Sell the set, not the unit — the volume leader is a five-piece curl-specific bundle at over 1.0M units.
- Carry at least one core technology claim — heat-free, high-speed brushless motor or all-in-one.
About the Data#
This analysis draws on Moojing Market Intelligence proprietary research into overseas e-commerce, covering one major marketplace in each of the US and the UK. The category is Hair Dryers & Accessories over the 24 months from June 2024 to May 2026. Figures are two-year totals unless stated as year-on-year growth, and price-band figures are period totals with no year-on-year series behind them. No category-level growth rate is reported, for the reason given above. Monetary values are CN¥ -denominated in the source and converted to USD at CN¥ 1 = $0.138. German market access was restricted and Japanese category volume is small, so these findings should not be generalised to other markets without separate analysis.
Download the Full Report#
Get the complete analysis: full price-ladder tables for both markets, the archetype revenue-share breakdown, and the export-challenger strategy comparison.
This content adheres to Moojing's editorial standards .


